Resources
This page contains some key resources on walking and cycling, including an archive of the documents produced by the Australian Bicycle Council.
| Date Added | |||
|---|---|---|---|
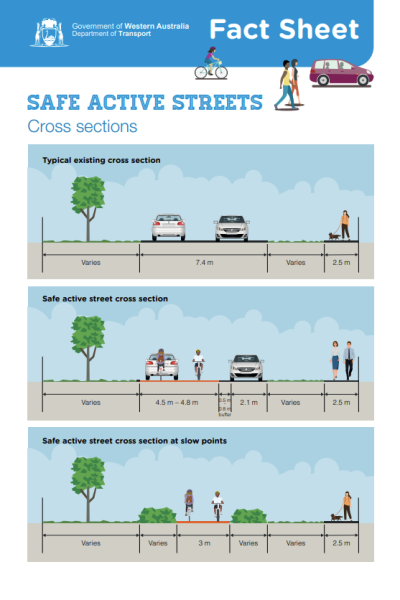 |
Safe Active Streets Pilot Program Department of Transport WA Department of Transport WA has been working with Western Australian local governments to develop, trial and evaluate ‘safe active streets’ which use local area traffic management treatments to encourage more people to walk, wheel and ride in their communities. |
18/03/2024 | View |
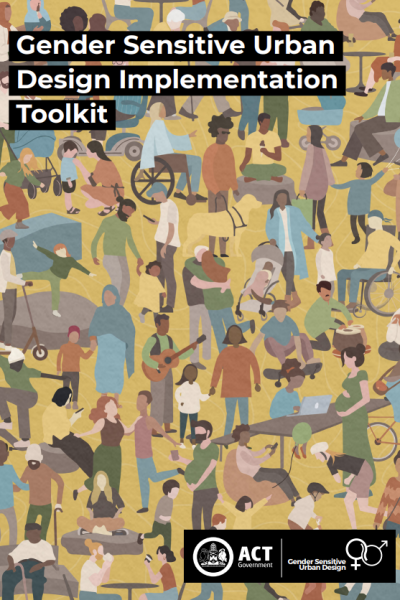 |
Gender Sensitive Urban Design Implementation Toolkit ACT Government The Gender Sensitive Urban Design (GSUD) Toolkit is a comprehensive resource designed to provide designers with essential principles, practices, and strategies for creating inclusive public spaces. With a particular focus on the needs of women, girls, gender diverse individuals, and other vulnerable people, the toolkit offers a range of strategies to address the multifaceted aspects of gender sensitivity in the public realm.
|
01/03/2024 | View |
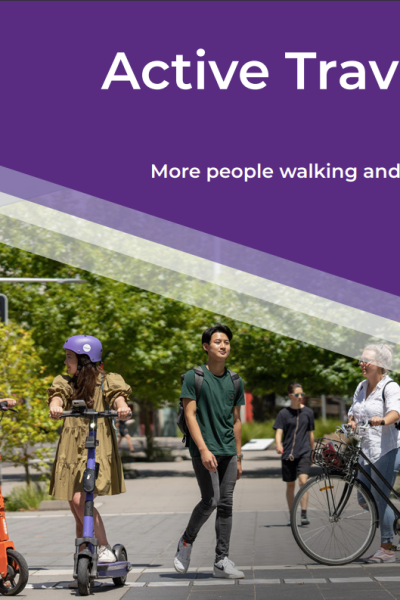 |
Active Travel Plan and Design Guide ACT Government This Plan outlines ACT Government priorities for strengthening active travel and improving quality of life. Projects included throughout demonstrate what these priorities mean in practice. |
01/03/2024 | View |
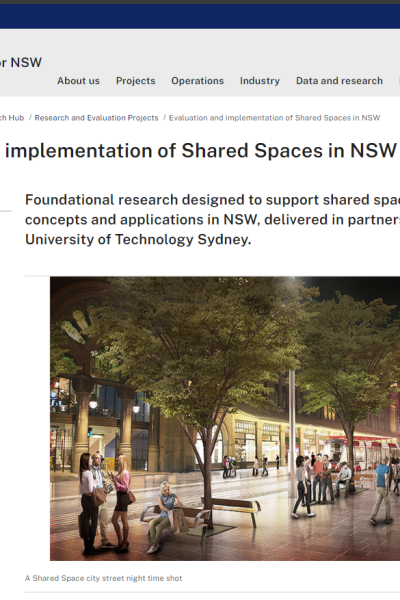 |
Evaluation and implementation of Shared Spaces in NSW Transport for NSW Foundational research designed to support shared space design concepts and applications in NSW, delivered by Transport for NSW in partnership with the University of Technology Sydney. |
16/02/2024 | View |
| Planning and designing for active transport Department of Transport Western Australia Collaborating with and guiding state and local government and industry partners to plan, design and develop active transport solutions to help make it an easy choice for people of all ages and abilities to walk, wheel and ride. |
02/02/2024 | View | |
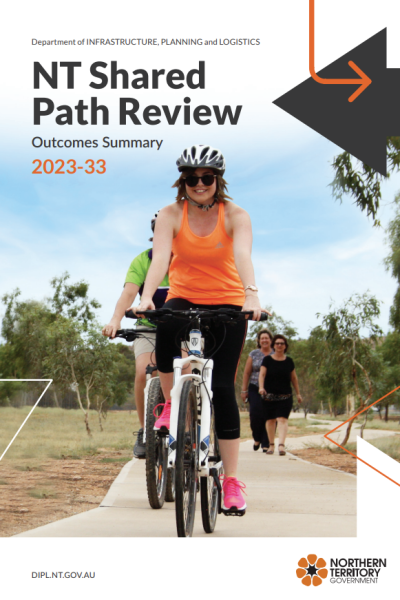 |
Northern Territory shared path network reviews Department of Infrastructure, Planning and Logistics (DIPL), Northern Territory The Department of Infrastructure, Planning and Logistics (DIPL) has completed a review of Northern Territory Government (NTG) owned shared paths across Greater Darwin, Katherine, Tennant Creek and Alice Springs. The review is key to continuing strategic development of shared paths in line with stakeholder and community needs for the next 10 years. The purpose of the review was to assess the existing NTG shared path networks and provide recommendations for:
A number of key considerations guided the review including efficiency, safety and connectivity. |
11/12/2023 | View |
 |
Australian Transport Assessment and Planning (ATAP) Mode Specific Guidance: M4 Active Travel Australian Transport Assessment and Planning (ATAP) At a glance:
|
13/11/2023 | View |
 |
Promotion, encouragement and behaviour change Department of Transport and Main Roads, Queensland On this page: |
27/10/2023 | View |
 |
Universal access Department of Transport and Main Roads, Queensland On this page: |
27/10/2023 | View |
 |
Speed management and integrated treatments Department of Transport and Main Roads, Queensland On this page: |
27/10/2023 | View |
 |
Road crossings Department of Transport and Main Roads, Queensland On this page: |
27/10/2023 | View |
 |
Paths for walking Department of Transport and Main Roads, Queensland On this page |
27/10/2023 | View |
 |
Construction and maintenance Department of Transport and Main Roads, Queensland On this page: |
27/10/2023 | View |
 |
Shade and street trees Department of Transport and Main Roads, Queensland On this page: |
27/10/2023 | View |
 |
Pedestrian and Walking Guidance: Supporting facilities Department of transport and Main Roads, Queensland On this page: |
27/10/2023 | View |
 |
Urban planning and urban design Department of Transport and Main Roads, Queensland On this page: |
27/10/2023 | View |
 |
Walking data Department of Transport and Main Roads, Queensland On this page: |
13/10/2023 | View |
 |
Pedestrian and Walking Guidance and Resources Department of Transport and Main Roads, Queensland Including:
|
13/10/2023 | View |
 |
Walking Network Planning Guidance Department of Transport and Main Roads, Queensland More people will walk when everyday destinations are connected by comfortable, direct, safe and accessible routes. Walking network plans (WNPs) are a first step to creating better places to walk. The Queensland Government is committed to achieving the Queensland Walking Strategy 2019–2029 vision of walking becoming 'an easy choice for everyone, every day'. When we talk about walking, we also include running and moving with the help of a mobility device (such as a wheelchair, mobility cane or a walking frame). The following guidance supports practitioners to prepare WNPs and a prioritised works program to make the plan a reality. |
13/10/2023 | View |
| Disability Standards for Accessible Public Transport 2002 (Transport Standards) Department of Infrastructure, Transport, Regional Development, Communications and the Arts The Disability Discrimination Act 1992(the Act) is in place to eliminate discrimination against people with disability as far as possible, and to promote community acceptance of the principle that people with disability have the same fundamental rights as all members of the community. The Act provides that direct and indirect discrimination on the basis of disability is unlawful in a broad range of areas of public life, including and access to goods, services and facilities. The Disability Standards for Accessible Public Transport 2002 (Transport Standards) provide requirements for public transport operators and providers to make their services accessible and remove discrimination against people with disability. The Transport Standards took effect on 23 October 2002. The Transport Standards apply to train, tram, bus and coach, ferry, taxi and aviation services and are designed to provide certainty to providers and operators of public transport services and infrastructure about their responsibilities under the Disability Discrimination Act 1992. |
13/10/2023 | View | |
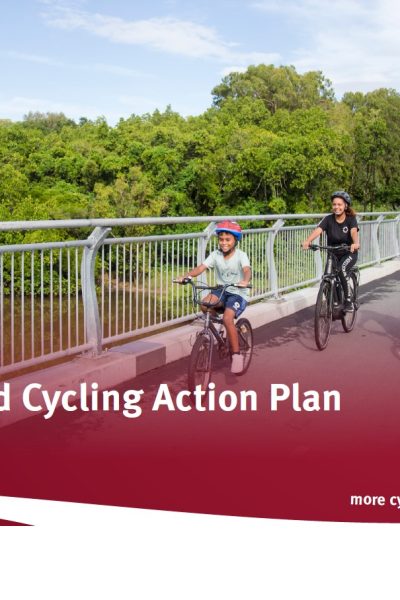 |
Queensland Cycling Action Plan 2023-2025 Department of Transport and Main Roads, Queensland The Queensland Cycling Action Plan 2023-2025 lists the practical actions the Queensland Government needs to do right now to grow cycling, to be updated every 2 years. This is the third action plan under the Queensland Cycling Strategy, which is helping achieve the Queensland Government's objectives for the community. The Queensland Cycling Action Plan 2020-2022 and Queensland Cycling Action Plan 2017-2019 are also available. The Queensland Cycling Strategy 2017-2027 and Queensland State of Cycling Report 2022 are also available. |
06/10/2023 | View |
 |
Queensland State of Cycling Report 2022 Department of Transport and Main Roads, Queensland The Queensland State of Cycling Report 2022 tracks the Queensland Government’s progress towards achieving the vision of ‘more cycling, more often’, to be updated every 2 years. This is the third report under the Queensland Cycling Strategy, which is helping achieve the Queensland Government's objectives for the community. The Queensland State of Cycling Report 2019 and Queensland State of Cycling Report 2017 are also available. The Queensland Cycling Strategy 2017-2027 and Queensland Cycling Action Plan are also available. |
06/10/2023 | View |
 |
National Walking and Cycling Participation Survey 2023 CWANZ The National Walking and Cycling Participation Survey (NWCPS) provides insight into walking and cycling activity across Australia and is a successor to the National Cycling Participation Survey which was conducted biennially from 2011 to 2019. |
22/09/2023 | View |
 |
Speed zones Transport for NSW Speed limits are set to allow you to safely respond to potential risks on the road. Lower speed limits apply in areas where there are more people and vehicles. This is to reduce the chance of crashes and serious injuries. Includes:
|
22/09/2023 | View |
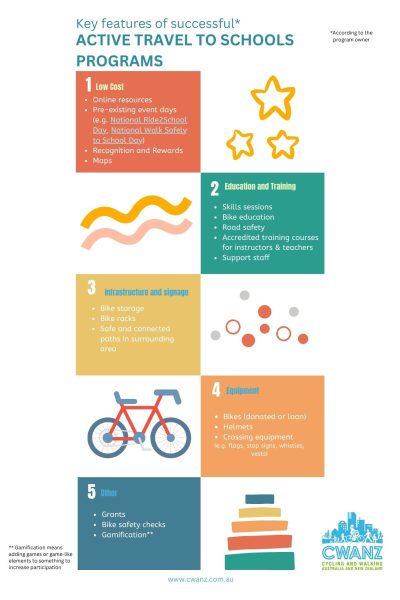 |
Active Travel to Schools Programs CWANZ An overview of active travel to schools programs across Australia and New Zealand, their key features and what makes them successful. Also includes a comparison of the number of children that use active travel to school from around the world. |
23/08/2023 | View |
 |
Pedestrian Demand Forecasting Tool Department of Transport and Main Roads, Queensland This tool provides an implementation of the three pedestrian forecasting procedures described in the TMR Pedestrian demand forecasting guideline. The guidance describes three forecasting procedures:
|
17/07/2023 | View |
 |
Pedestrian Demand Forecasting Guideline Department of Transport and Main Roads, Queensland The intent of this document is to provide guidance to practitioners to forecast demand for pedestrians
|
17/07/2023 | View |
|
Planning for walking Department of Transport and Main Roads, Queensland Including:
|
17/07/2023 | View |
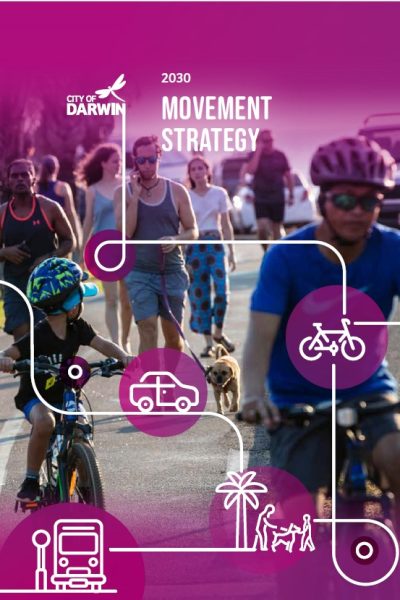 |
Movement Strategy City of Darwin The Movement Strategy aims to make it easier for all people to move around our suburbs and city by improving streetscapes, infrastructure and connectivity while reducing the impact of transport on the environment. The Movement Strategy creates a framework and direction to align investment and policy decisions with the aspirations of the community. |
02/06/2023 | View |
| Getting to and from public transport Waka Kotahi NZ Transport Agency Getting to and from public transport is integral to every public transport journey. All passengers must make their way to a public transport stop to board public transport, then make their way from where they disembark to their final destination. Often referred to as the ‘first and last mile’, the actual length of these trips can range from less than 100m to many kilometres. First and last mile connections are critical to a viable and enjoyable public transport journey experience. Key issues relating to the quality and ease of access to and from a public transport stop include:
It is important that those involved in public transport planning consider the whole of the passengers' journey. When planning for public transport journeys, the following questions should be considered:
|
19/05/2023 | View | |
 |
Research Report 512 The New Zealand accessibility analysis methodology Waka Kotahi NZ Transport Agency This research considers land use and transport accessibility drawing on international practice from the UK, Europe, USA and Australia. An objective of the research was to define accessibility and propose a methodology for how accessibility could be measured and quantified in New Zealand, both at a neighbourhood or a wider area such as a suburb, city or region. The result of the research was an understanding of other countries’ experiences developing and setting accessibility policy and the success of those approaches. This is important because if New Zealand chooses to set explicit accessibility policy, the research explains how that might be best achieved. A second result of the research was the development of a new methodology for calculating accessibility that draws on overseas and improved practice. The new methodology quantitatively measures accessibility taking into consideration different modes of travel (walk, cycle, private motor vehicle etc), travel behaviour (ideally using logistic decay functions), destinations (origin or destination based), activities (consumed or supplied) and multiple opportunities (saturations). The calculation methodology was piloted on Christchurch (a city of some 350,000 people) and the accessibility of every household quantified to a variety of destinations including doctors, supermarkets and schools. Keywords: accessibility, cycling, GIS, indicators, journey planning, methodology, modelling, networks, New Zealand, public transport, transport, walking |
19/05/2023 | View |
 |
Research Report 363 Accessibility planning methods Waka Kotahi NZ Transport Agency This research investigated the applicability of accessibility planning in New Zealand as a tool for assessing and improving personal access to essential services for all New Zealanders. It canvassed international accessibility planning practices in England, the Netherlands and Southern California to understand the various drivers for its introduction and the different approaches taken in its implementation. All three case studies share the goal of improving individuals’ access to activity centres and recognise that accessibility planning is best undertaken at the local level with some form of central government guidance and monitoring. The English comprehensive accessibility planning framework has been adapted to New Zealand’s existing social services and local government legislative and institutional environment and the recently legislated changes to the government land transport sector. The resulting recommended framework employed a collaborative approach to assess and improve people’s accessibility to employment, food shopping, health, education and social services across New Zealand. All levels of government would participate in the assessment of accessibility, development of priorities, indicators and action plans and monitor progress against outcomes, within government frameworks. Transport actions developed by regional accessibility partnerships to address regional problems would feed directly into their regional land transport programmes for prioritisation for funding. |
19/05/2023 | View |
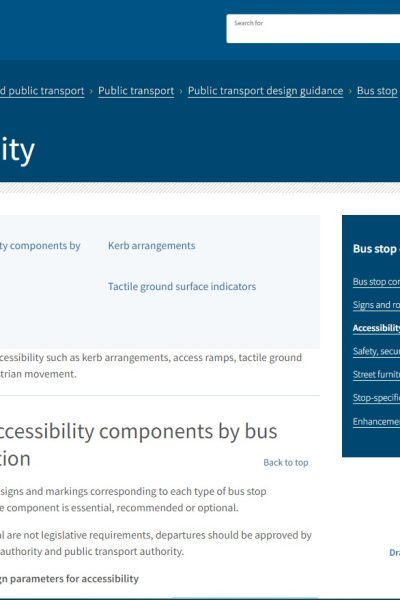 |
Accessibility Waka Kotahi NZ Transport Agency Key design parameters for accessibility such as kerb arrangements, access ramps, tactile ground surface indicators, and pedestrian movement. |
19/05/2023 | View |
 |
Disability Access and Inclusion Plan 2020-2022 Department for Infrastructure and Transport, South Australia The Disability Access and Inclusion Plan details the Department for Infrastructure and Transport’s commitment to promoting, protecting and enhancing the rights of people living with disability in South Australia. The Plan includes clear and measurable actions and targets designed through community and Departmental consultation to give effect to the priority areas of the first State Disability Inclusion Plan 2019-2023, as they relate to the purpose and activities of the Department. |
19/05/2023 | View |
 |
Disability Inclusion Action Plan 2018 – 2022 Transport for NSW The NSW Government is funding numerous projects under the Transport Access Program to upgrade train stations, ferry wharves and interchanges. New infrastructure, such as the Sydney Metro Northwest and the CBD and South East Light Rail, are being built to the very highest standards of accessibility. We have invested in new trains, buses and ferries – all which have improved accessibility features. The Disability Inclusion Action Plan 2018-2022 builds upon the successes of the previous plan, the Disability Action Plan 2012-2017, to set an ambitious agenda for the next five years. This document presents a vision of a more accessible future for transport in NSW. More importantly, it outlines concrete, measurable steps towards achieving that vision. |
19/05/2023 | View |
|
Disability Access and Inclusion Plan Department of Transport, Main Roads Western Australia and Public Transport Authority The PTA, together with our Transport Portfolio partners Main Roads and the Department of Transport, has developed the Transport Portfolio Disability Access and Inclusion Plan (DAIP) for 2022-2027. The DAIP aims to ensure that people with a disability have the same opportunity as other people to access PTA public transport services, information and facilities. The PTA has also developed the PTA Implementation Plan for Transport Portfolio Disability Access and Inclusion Plan which demonstrates our commitment to providing a high level of independence for all passengers. |
19/05/2023 | View |
 |
Accessibility Policy Public Transport Authority Western Australia The PTA Accessibility Policy has been developed as the overarching document for access. Our Accessibility Policy outlines how the PTA shall, as far as reasonably practical, provide public passenger transport services and facilities that are accessible to all passengers. |
19/05/2023 | View |
|
Transport Accessibility Strategy Department of Transport and Planning The Victorian Government is working to ensure our public transport network is inclusive and accessible for all Victorians. In Victoria, 1.1 million people have either a physical or non-physical disability. Our ageing population and those with other mobility barriers also need accessibility support on the transport network. |
19/05/2023 | View |
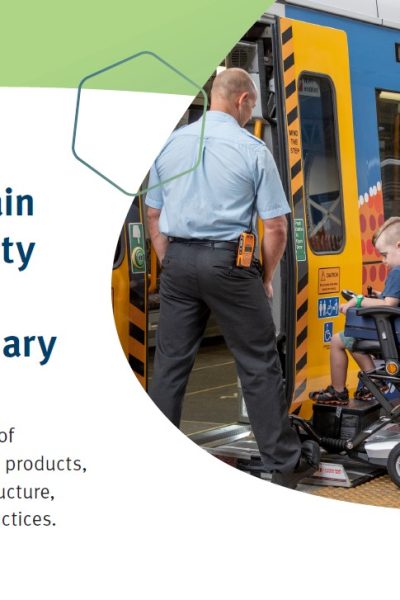 |
Accessibility and Inclusion Strategy Summary Department of Transport and Main Roads Queensland TMR commits to lead the delivery of accessible and inclusive transport products, services, information and infrastructure, and TMR workplaces and work practices. |
19/05/2023 | View |
 |
Accessibility and Inclusion Plan 2023–2024 Department of Main Roads and Transport Queensland The TMR Accessibility and Inclusion Plan 2023–2024 was developed to outline the practical actions TMR will take over the next 2 years to deliver our vision. To develop the plan, we looked at best practice research, data and analysis, international accessibility and inclusion reporting frameworks, key indicators of success, and we engaged our customers, partners and staff. This plan outlines 27 actions across 3 key pillars:
We will report our progress on the plan actions and in 2024 we will develop an updated plan based on key learnings, co-design activities and emerging trends. This plan is available in the following accessible formats:
|
19/05/2023 | View |
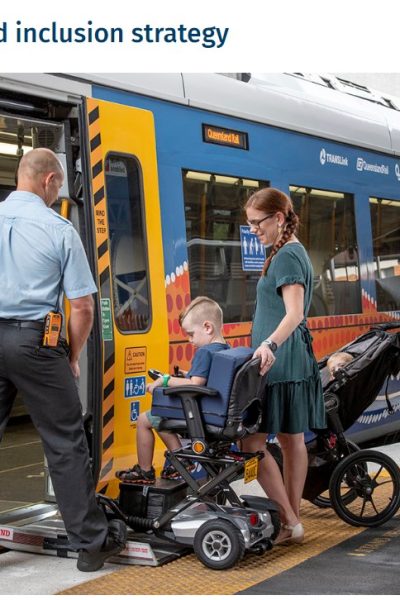 |
Accessibility and inclusion strategy Department of Main Roads and Transport, Queensland The Accessibility and Inclusion Strategy (AIS) will ensure that TMR's approach to accessibility and inclusion aligns with the Queensland Government's Advancing Queensland's Priorities. |
19/05/2023 | View |
 |
Evaluation of permanent 40km/h speed limits: Summary report Transport for NSW |
17/05/2023 | View |
 |
40 km/h speed limits in high volume pedestrian areas Transport for NSW A guide to identifying and implementing 40 km/h speed limits in high volume pedestrian areas. |
15/05/2023 | View |
 |
Personal mobility device plans Deaprtment of Transport and Main Roads, Queensland Personal mobility devices include things like e-scooters, e-skateboards and self-balancing one or two-wheelers. The recent boom in the use of personal mobility devices has created some safety issues as riders share a range of infrastructure with other road and path users. Shared e-scooter and e-bike hire schemes have also become commonplace across Queensland. While these schemes are a great mobility option, they have created some problems with parking on footpaths. To address safety and parking concerns Deaprtment of Transport and Main Roads, Queensland are delivering:
|
01/05/2023 | View |
 |
Personal mobility devices Department of Transport and Main Roads, Queensland Know your way around Personal Mobility Devices such as e-scooters, e-skateboards and segways.
|
01/05/2023 | View |
 |
Waka Kotahi Cycling Action Plan Waka Kotahi NZ Transport Agency The Waka Kotahi Cycling Action Plan sets out a pathway to significantly increase the safety and attractiveness of cycling and micromobility in towns and cities across Aotearoa New Zealand. It outlines the strategic priorities for Waka Kotahi, and includes the detailed actions we will take, alongside our partners, to help achieve the substantial shifts required. While it is not a funding plan, it will help inform future transport prioritisation and investment decisions. |
01/05/2023 | View |
 |
Get NSW Active Transport for NSW The Get NSW Active program provides local councils with funding for projects that create safe, easy and enjoyable walking and cycling trips. These trips help to relieve pressure on our roads and public transport networks and are part of a healthy lifestyle for NSW communities. |
01/05/2023 | View |
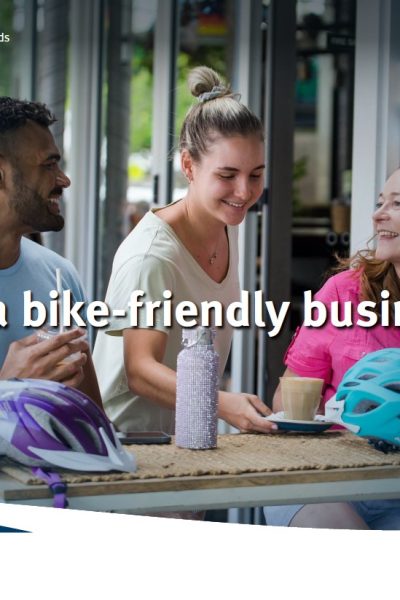 |
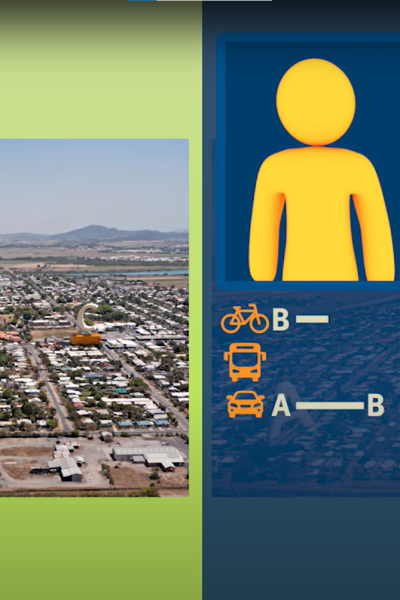
Bike-friendly business Department of Transport and Main Roads, Queensland Bike riders are customers who choose to arrive by bike. There’s a big opportunity for businesses to achieve growth by becoming bike-friendly. More than ever, bike riders want to go from A to Business. There’s growing demand to stop, shop and spend at bike-friendly businesses of all different types, from local cafes right through to tourism destinations. Being bike-friendly can be a point of difference for a business. It means the business can offer more customers more choice and freedom. |
06/04/2023 | View |
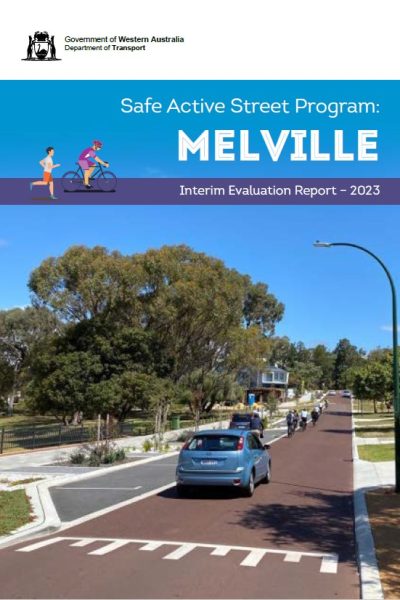 |
Safe Active Streets Pilot Program Evaluation Department of Transport WA The Safe Active Street (SAS) Program’s vision is to create shared street spaces that provide a convenient travel option within a safe and attractive environment for people riding and walking of all ages and abilities. To achieve the vision of the SAS Program the following objectives have been established:
The SAS Pilot Program is being evaluated in line with DoT’s SAS Pilot Program Evaluation Plan, which has adopted a summative evaluation framework that considers impacts, cost effectiveness and comparability between projects. The SAS Pilot Program Evaluation Plan clearly details in an Outcomes Measurement Framework the specific indicators, targets, and data sources to adequately evaluate the program. |
05/04/2023 | View |
 |
Active Travel to School Roadmap 2023-2030 Department of Transport WA The Active Travel to School Roadmap aims to reverse the declining rate of walking and cycling to school in Perth. Containing 24 initiatives, the Roadmap seeks to address key urban planning, policy, individual and social factors, and enable more children to walk, bike ride, scoot and catch public transport to school. The Roadmap was developed by a dedicated Active Travel to School Working Group, which was established by the Bicycle Riding Reference Group, and has been endorsed by the Departments of Transport, Education and Health, the Road Safety Commission, the Western Australian Local Government Association and the Institute of Public Works and Engineering Australasia. Delivery of the Roadmap will commence in 2023 and progress will be reported to the Bicycle Riding Reference Group. |
21/03/2023 | View |
 |
Active Travel to School: Ride or Walk to School (Safe Cycle) Transport Canberra and City Services PROGRAM FEATURES:
DATE IMPLEMENTED: 1 December 2012 COST OF PROGRAM: $75,000 per year COST FOR USERS: Free ADDITIONAL INFORMATION: The Ride or Walk to School program (primary) and It's Your Move Safe Cycle program (high school) provides ACT schools with safe cycling resources. It is aligned to the Australian curriculum and includes teacher training and information for parents. The aim is to increase the number of children walking and riding to and from school. Part of program incorporating infrastructure, signage (Active Streets), and safety at school crossings (School Crossing Supervisors) to encourage children to use active travel to get to and from school. RESULTS OF EVALUATION: |
14/03/2023 | View |
|
Active Travel to School Program: School Transport Infrastructure Program Department of Transport and Main Roads, Queensland PROGRAM FEATURES: Funding to improve the safety and operation of schools through new or improved infrastructure at the school and/or on the surrounding road network. E.g.:
DATE IMPLEMENTED: Not available COST OF PROGRAM: Not available. Grants up to $500,000 available COST TO USER: Funding usually provided on a 50:50 subsidy basis, e.g. co-funding between Department of Transport and Main Roads and local government RESULTS OF EVALUATION: Not available |
28/02/2023 | View |
|
Safer Speeds Case Study - Padbury, Western Australia STREET NAME: Local residential streets SUBURB: Padbury MUNICIPALITY: City of Joondalup STATE & COUNTRY: Western Australia, Australia SPEED REDUCTION: From 50 km/h to 30 km/h DATE IMPLEMENTED: NA SCHEME INCLUDED:
COST: Not available ADDITIONAL INFORMATION:
RESULTS OF EVALUATION: Not available |
28/02/2023 | |
|
Active Travel to School Program: Walk to School City of Whittlesea PROGRAM FEATURES:
DATE IMPLEMENTED: Not available COST: Not available |
14/02/2023 | View |
|
Active Travel to School Program: Stroll & Roll Latrobe City Council PROGRAM FEATURES:
DATE IMPLEMENTED: 30 January 2022 COST OF PROGRAM: Not available COST FOR USERS: None RESULTS OF EVALUATION: Not available |
14/02/2023 | View |
|
Active Travel to School Program: Safe Routes to School Program WestCycle PROGRAM FEATURES: Part of Bike Friendly Schools Program DATE IMPLEMENTED: Not available COST: Not available RESULTS OF EVALUATION: Not available |
30/01/2023 | View |
|
Active Travel to School Program: Whittlesea Active Travel in Schools City of Whittlesea PROGRAM FEATURES:
DATE IMPLEMENTED: 2013 COST: Not available RESULTS OF EVALUATION: Not available |
30/01/2023 | View |
|
Active Travel to School Program: Port Sorell Primary School - Active Travel to School Port Sorell Primary School PROGRAM FEATURES:
DATE IMPLEMENTED: 2013 COST: Not available RESULTS OF EVALUATION: Not available |
30/01/2023 | View |
|
Active Travel to School Program: Safe school travel (SafeST) program Queensland Government PROGRAM FEATURES:
DATE IMPLEMENTED: Not available COST: Not available RESULTS OF EVALUATION: Not available |
30/01/2023 | View |
|
Active Travel to School Program: Ipswich Healthy Active School Travel City of Ipswich PROGRAM FEATURES:
DATE IMPLEMENTED: Not available COST: Not available RESULTS OF EVALUATION: Not available |
30/01/2023 | View |
|
Active Travel to School Program: National Walk Safely to School Day Pedestrian Council of Australia PROGRAM FEATURES:
DATE IMPLEMENTED: Not available COST: Not available. Free for schools. RESULTS OF EVALUATION: Not available |
30/01/2023 | View |
|
Active Travel to School Program: Active School Travel, Sunshine Coast Council Sunshine Coast Council PROGRAM FEATURES:
DATE IMPLEMENTED: Not available COST: Not available RESULTS OF EVALUATION: Not available |
30/01/2023 | View |
|
Active Travel to School Program: Bike Friendly Schools WestCycle PROGRAM FEATURES:
DATE IMPLEMENTED: Not available COST: Not available RESULTS OF EVALUATION: Not available |
30/01/2023 | View |
|
Active Travel to School Program: Your Move Schools Department of Transport, WA PROGRAM FEATURES:
DATE IMPLEMENTED: 2017 COST OF PROGRAM: Not available COST FOR USERS: None RESULTS OF EVALUATION: Not available |
30/01/2023 | View |
|
Active Travel to School Program: Walk to School Month City of Moonee Valley PROGRAM FEATURES:
DATE IMPLEMENTED: Not available COST: Not available RESULTS OF EVALUATION: Not available |
30/01/2023 | View |
|
Active Travel to School Program: Walk to School (VicHealth) VicHealth PROGRAM FEATURES:
DATE IMPLEMENTED: Not available COST OF PROGRAM: Not available COST FOR USERS: None RESULTS OF EVALUATION: Not available |
30/01/2023 | View |
|
Active Travel to School Program: The Healthy Schools Achievement Program Cancer Council Victoria PROGRAM FEATURES:
DATE IMPLEMENTED: Not available COST: Not available. Free for schools. RESULTS OF EVALUATION: Not available |
30/01/2023 | View |
|
Active Travel to School Program: Move Well, Eat Well (Stride and Ride) Department of Health, Tasmania PROGRAM FEATURES: Stride and Ride:
DATE IMPLEMENTED: Not available COST OF PROGRAM: Not available COST FOR USERS: None RESULTS OF EVALUATION: Not available |
30/01/2023 | View |
|
Active Travel to School Program: Way2Go Bike Ed Department for Infrastructure and Transport, South Australia PROGRAM FEATURES:
DATE IMPLEMENTED:
COST OF PROGRAM: Not available COST FOR USERS: Free for schools RESULTS OF EVALUATION: Report |
30/01/2023 | View |
|
Active Travel to School Program: Way2Go Department for Infrastructure and Transport, South Australia PROGRAM FEATURES:
DATE IMPLEMENTED: Commenced in 2005 as Safe Routes to School, re-branded to Way2Go in 2009 COST OF PROGRAM: Not available COST FOR USERS: Free for schools RESULTS OF EVALUATION: Not available |
30/01/2023 | View |
|
Active Travel to School Program: Go Noosa Schools Noosa Council PROGRAM FEATURES:
DATE IMPLEMENTED: Not available COST: Not available RESULTS OF EVALUATION: Not available |
30/01/2023 | View |
|
Active Travel to School Program: Active School Travel, City of Gold Coast City of Gold Coast PROGRAM FEATURES: Schools that join the program receive a suite of resources including free toolkits, incentives and support. Including:
Educational programs:
DATE IMPLEMENTED: Not available COST: Not available RESULTS OF EVALUATION: Not available |
30/01/2023 | View |
|
Active Travel to School Program: Active School Travel Program, Brisbane City Council Brisbane City Council PROGRAM FEATURES: The Active School Travel (AST) program offers Brisbane primary schools a suite of free resources, tools and incentives to enable students, parents, carers and teachers to leave the car at home and actively travel to school. Participating schools will receive access resources, including:
Other resources:
DATE IMPLEMENTED: 2004 COST OF PROGRAM: FY 2022-23 $699,000 COST FOR USERS: Free for schools. RESULTS OF EVALUATION: Since 2004, 168 schools and more than 127,000 students have participated in the program. Achievements in 2021:
Approximately 90% of AST committee members agreed the AST program helped to increase student physical activity levels and foster community cohesion at their school. |
30/01/2023 | View |
|
Active Travel to School Program: Active School Travel, Bicycle Queensland Bicycle Queensland PROGRAM FEATURES: Resources for schools:
Online resouces:
DATE IMPLEMENTED: 2021 COST OF PROGRAM: Not available. Funding provided by community road safety program COST TO USERS: None RESULTS OF EVALUATION: Not available |
17/01/2023 | View |
|
Active Travel to School Program: Darwin Safe and Active Routes to School Tool Kit City of Darwin PROGRAM FEATURES: A toolkit that provides a step by step approach for schools to create a program and activity for schools and families to promote active travel to school. The toolkit is divided into the following categories:
DATE IMPLEMENTED: August 2016 COST OF PROGRAM: Not available COST TO USER: None ADDITIONAL INFORMATION: Other resources available are:
RESULTS OF EVALUATION: Not available |
17/01/2023 | View |
|
Active Travel to School Program: Switch it Up NSW Education PROGRAM FEATURES:
DATE IMPLEMENTED: Not available COST: Not available RESULTS OF EVALUATION: Not available |
17/01/2023 | View |
|
Active Travel to School Program: BikeReady (NSW) NSW Health PROGRAM FEATURES: Resource to support communities and schools to encourage more young people to walk or cycle, and to involve young people in the development and implementation of an active travel initiative. Includes:
DATE IMPLEMENTED: Not available COST: Not available RESULTS OF EVALUATION: Not available |
17/01/2023 | View |
|
Active Travel to School: Bikes in Schools Waka Kotahi New Zealand Transport Agency PROGRAM FEATURES: A typical Bikes in Schools package includes:
Online resources also available, including bike games. DATE IMPLEMENTED: Not available COST: Not available ADDITIONAL INFORMATION: Part of program that also includes BikeReady RESULTS OF EVALUATION: Not available |
17/01/2023 | View |
|
Active Travel to School Program: BikeReady (NZ) Waka Kotahi New Zealand Transport Agency PROGRAM FEATURES:
DATE IMPLEMENTED: Not available COST: Not available ADDITIONAL INFORMATION: Part of program that also includes Bikes in Schools RESULTS OF EVALUATION: Not available |
17/01/2023 | View |
|
Active Travel to School Program: Bikes for Schools AusCycling PROGRAM FEATURES:
DATE IMPLEMENTED: Not available COST: Not available ADDITIONAL INFORMATION: Ride Nation funds:
Plus they:
RESULTS OF EVALUATION: Not available |
16/01/2023 | View |
|
Active Travel to School Program: Ride Nation Schools AusCycling PROGRAM FEATURES: Ride Nation Schools is a learn-to-ride Bike Education Program delivered in schools Australia-wide. It is a fun and interactive learning experience that teaches young people to develop their riding skills and confidence – supporting kids in their independence and giving parents peace of mind. DATE IMPLEMENTED: Not available COST: Not available ADDITIONAL INFORMATION: There are three levels of bike education programs in schools: Ride Nation - Skills (Playground): Recommended for grades 2-3, this 4–6-week program focuses on developing the essential bike control skills braking, balancing and riding. The skills learnt in this program will allow them to ride around in traffic free environments (school yard, park and around the block). Ride Nation - Confidence (Pathways): Recommended for grades 3-5. Once grasping the essential bike control skills, participants are ready to develop their riding confidence. This 4-6-week program focuses on riding and situational awareness, providing students with the skills and competences to enable them to start riding on footpaths and shared pathway in low traffic environments. This program is ideal to start having students riding to and from school! Ride Nation - Explore (Places): Recommended for grades 5-6. Looks at utilising all the skills learnt through previous programs and develop them in different cycling situations and explore their local area by developing road safety and situational awareness. The program consists of four weeks of practical skill development and learning and ends with two local community rides for children to understand what is in their community. RESULTS OF EVALUATION: Not available |
16/01/2023 | View |
|
Active Travel to School Program: RideScore We Ride Australia PROGRAM FEATURES: RideScore Active Schools uses technology to direct message parents when their children have arrived safely at school. The program uses:
DATE IMPLEMENTED: November 219 COST: Not available ADDITIONAL INFORMATION: RESULTS OF EVALUATION: In progress |
16/01/2023 | View |
|
Active Travel to School Program: Open Streets Bicycle Network PROGRAM FEATURES:
DATE IMPLEMENTED: Not available COST: Not available ADDITIONAL INFORMATION: Part of suite of programs to help break down the barriers that prevent more students from staying active on their journey to school. Culminates in National Ride2School Day. RESULTS OF EVALUATION: Not available |
16/01/2023 | View |
|
Active Travel to School Program: Ride2School Bicycle Network PROGRAM FEATURES:
DATE IMPLEMENTED: Not available COST: Not available ADDITIONAL INFORMATION: Suite of programs to help break down the barriers that prevent more students from staying active on their journey to school. Culminates in National Ride2School Day. RESULTS OF EVALUATION: Not available |
09/01/2023 | View |
|
Active Travel to School Program: School Crossing Supervisors Transport Canberra and City Services PROGRAM FEATURES: School crossing supervisors (lollipop people) to assist children to cross roads safely by directing traffic with a stop sign and providing instructions. They also help to manage the flow of pedestrians and motorists at the busiest crossings. DATE IMPLEMENTED: 1 January 2018 COST OF PROGRAM: $700,000 per year COST FOR USERS: None ADDITIONAL INFORMATION: Part of program incorporating infrastructure, signage (Active Streets), training and other resources (Ride or Walk to School) to encourage children to use active travel to get to and from school. RESULTS OF EVALUATION: Not available |
09/01/2023 | View |
|
Active Travel to School Program: Active Streets for Schools (ACT) Transport Canberra and City Services PROGRAM FEATURES:
DATE IMPLEMENTED: 1 July 2015 COST OF PROGRAM: $500,000 per year COST FOR USERS: None ADDITIONAL INFORMATION: Infrastructure improvements include a combination of upgrades to existing infrastructure and new works, focusing on paths, crossings and treatments to slow vehicle speeds. Blue stencils are installed along paths to provide wayfinding signage to local schools. The stencils give families the peace of mind the route to school is safe and easy to follow. The stencils promote:
Part of program incorporating training and other resources (Ride or Walk to School), and safety at school crossings (School Crossing Supervisors) to encourage children to use active travel to get to and from school. RESULTS OF EVALUATION: Report |
09/01/2023 | View |
 |
Safer Speeds Case Study - City of Yarra, Melbourne STREET NAMES: Treatment area located between Alexandra Parade (north), Hoddle Street (east), Johnston Street (south) and Nicholson Street (west) SUBURBS: Fitzroy and Collingwood MUNICIPALITY: City of Yarra, Melbourne STATE & COUNTRY: Victoria, Australia SPEED REDUCTION: From 40 km/h to 30 km/h DATE IMPLEMENTED: December 2019 SCHEME INCLUDED:
COST: Not available ADDITIONAL INFORMATION: Non-treatment area for control purposes located adjacent to the treatment area. WHY?
LESSONS LEARNED: The scheme included signage only. With additional infrastructure calming measures such as curb extensions, speed bumps, intersection platforms, further speed reduction improvements would be expected. The choice control region for this study was not seen as ideal. |
20/12/2022 | |
|
Safer Speeds Case Study - Wellington, New Zealand Wellington City Council STREET NAME: Most central city streets (not main through roads) SUBURB: Wellington COUNTRY: New Zealand SPEED REDUCTION: From 50 km/h to 30 km/h DATE IMPLEMENTED: June 2020.80% of roads within Wellington approved to have speeds recuced to 30 kph Septmber 2022 SCHEME INCLUDED:
COST: $NZ44.8 million (from September 2022) ADDITIONAL INFORMATION:
RESULTS OF EVALUATION: Not available |
20/12/2022 | View |
|
Safer Speeds Case Study - Auckland City Centre Auckland Transport STREET NAME: Multiple SUBURB: Auckland COUNTRY: New Zealand SPEED REDUCTION: Mostly from 50 km/h to 30 km/h DATE IMPLEMENTED: 30 June 2020 SCHEME INCLUDED:
COST: $NZ 49,297,544 (includes reduction of speed limits on all roads including urban and rural) ADDITIONAL INFORMATION:
LESSONS LEARNED:
RESULTS OF EVALUATION: Not available |
20/12/2022 | View |
 |
Safer Speeds Case Study - High Pedestrian Activity Areas, NSW Transport for NSW LOCATION: Multiple SUBURB: Multiple MUNICIPALITY: Multiple STATE & COUNTRY: New South Wales, Australia SPEED REDUCTION: Various to 40 km/h DATE IMPLEMENTED: 2003 SCHEME INCLUDED:
COST: Not available ADDITIONAL INFORMATION:
LESSONS LEARNED:
|
20/12/2022 | View |
|
Safer Speeds Case Study - Melbourne Shopping Strips Department of Transport, Victoria LOCATION: Multiple busy shopping strip centres SPEED REDUCTION: 50 km/h to 40km/h MUNICIPALITY: Multiple STATE & COUNTRY: Victoria, Australia SCHEME INCLUDED:
DATE IMPLEMENTED: Various COST: Not available ADDITIONAL INFORMATION: Introduced in areas of high pedestrian activity LESSONS LEARNED:
|
20/12/2022 | View |
|
Safer Speeds Case Study - Melbourne City of Melbourne STREET NAME: Local roads across inner Melbourne SUBURB: Melbourne MUNICIPALITY: City of Melbourne STATE & COUNTRY: Victoria, Australia SPEED REDUCTION: From 50 km/h to 40 km/h DATE IMPLEMENTED: September 2022 - ongoing SCHEME INCLUDED:
COST: Not available ADDITIONAL INFORMATION:
RESULTS OF EVALUATION: Not available |
19/12/2022 | View |
 |
Safer Speeds Case Study - Little Streets, Melbourne City of Melbourne STREET NAME: One-way sections of Flinders Lane, Little Collins Street, Little Bourke Street and Little Lonsdale Street SUBURB: Melbourne MUNICIPALITY: City of Melbourne STATE & COUNTRY: Victoria, Australia SPEED REDUCTION: From 40 km/h to 20 km/h DATE IMPLEMENTED: September 2020 SCHEME INCLUDED:
COST: Not available ADDITIONAL INFORMATION:
RESULTS OF EVALUATION: Not available |
19/12/2022 | View |
|
Safer Speeds Case Study - City of Charles Sturt, South Australia City of Charles Sturt STREET NAME: Multiple SUBURB: Multiple MUNICIPALITY: City of Chalres Sturt, Adelaide STATE & COUNTRY: South Australia, Australia SPEED REDUCTION: From 40 km/h to 30 km/h DATE IMPLEMENTED: 2012 SCHEME INCLUDED:
COST: $5,000-$10,000 ADDITIONAL INFORMATION:
LESSONS LEARNED:
RESULTS OF EVALUATION: Not available |
19/12/2022 | View |
|
Safer Speeds Case Study - City of Vincent, Perth City of Vincent STREET NAME: Local residential streets in the areas bounded by Newcastle, Vincent and Charles Streets and the Swan River (does not include main distributor roads) SUBURB: Southern suburbs of City of Vincent (Highgate, Mount Lawley) MUNICIPALITY: City of Vincent, Perth STATE & COUNTRY: Western Australia, Australia SPEED REDUCTION: From 50 km/h to 40 km/h DATE IMPLEMENTED: April 2019 SCHEME INCLUDED:
COST: Not available ADDITIONAL INFORMATION:
RESULTS OF EVALUATION: Not available |
19/12/2022 | View |
|
Safer Speeds Case Study - Fremantle, Western Australia City of Fremantle STREET NAME: Multiple (40 km/h zone) and South Terrace (30 km/h) SUBURB: Fremantle MUNICIPALITY: City of Fremantle STATE & COUNTRY: Western Australia, Australia SPEED REDUCTION: From 50 km/h to 40 km/h (zone) and 30 km/h (South Terrace) DATE IMPLEMENTED: July 2021 SCHEME INCLUDED:
COST: Not available ADDITIONAL INFORMATION: No formal evaluation or after studies to measure impact, however a lot of community support for lower speeds, particularly along South Terrace. LESSONS LEARNED: Used to test Main Roads WA new speed limit policy. RESULTS OF EVALUATION: Not available |
19/12/2022 | View |
|
Safer Speeds Case Study - Bayswater, Western Australia STREET NAME: Railway Parade and Whatley Crescent SUBURB: Bayswater MUNICIPALITY: City of Bayswater, Perth STATE & COUNTRY: Western Australia, Australia SPEED REDUCTION: From 50 km/h to 30 km/h DATE IMPLEMENTED: January 2020 (trial start October 2018) SCHEME INCLUDED:
COST: Not available ADDITIONAL INFORMATION: Temporary reduction while increased number of bike riders on road due to modifications to adjacent railway line and Principal Shared Path RESULTS OF EVALUATION: Not available |
19/12/2022 | |
|
Safer Speeds Case Study - Manly & Liverpool, NSW Transport for NSW STREET NAME: Multiple SUBURB: Manly and Liverpool MUNICIPALITY: Northern Beaches Council and Liverpool City Council STATE & COUNTRY: New South Wales, Australia SPEED REDUCTION: From 40 km/h to 30 km/h DATE IMPLEMENTED: July 2020 SCHEME INCLUDED:
COST: Not available RESULTS OF EVALUATION: Not available |
19/12/2022 | View |
|
Safer Speeds Case Study - Sydney CBD Transport for NSW STREET NAME: Multiple SUBURB: Sydney MUNICIPALITY: City of Sydney STATE & COUNTRY: New South Wales, Australia SPEED REDUCTION: From 50 km/h to 40 km/h DATE IMPLEMENTED: 2016, August 2019 SCHEME INCLUDED:
COST: Not available ADDITIONAL INFORMATION:
RESULTS OF EVALUATION: Not available |
19/12/2022 | View |
|
Safer Speeds Case Study - Brisbane Brisbane City Council STREET NAME: 1. Ann Street (between Creek Street and the Riverside Expressway); 2. Village precint:
3. Station Road, Indooroopilly 4. Flinders Parade, Sandgate 5. Kelvin Grove Urban Village SUBURB: Brisbane MUNICIPALITY: Brisbane City Council STATE & COUNTRY: Queensland, Australia SPEED REDUCTION: 1 & 2. From 60 km/h to 40 km/h 3-5. From 50 km/h to 40 km/h DATE IMPLEMENTED: 1. November 2018 2. May 2019 3 & 4. September 2019 5. Febraury 2020 SCHEME INCLUDED:
COST: Not available ADDITIONAL INFORMATION: LESSONS LEARNED: RESULTS OF EVALUATION: Not available |
19/12/2022 | View |
|
Safer Speeds Case Study - Safe Active Streets, Perth, Western Australia Department of Transport, WA STREET NAME: Multiple SUBURB: Multiple MUNICIPALITY: Multiple STATE & COUNTRY: Western Australia, Australia SPEED REDUCTION: From 50 km/h to 30 km/h DATE IMPLEMENTED: September 2017 - ongoing SCHEME INCLUDED:
COST: Not available ADDITIONAL INFORMATION: Evaluation currently being undertaken and is due to be released in 2023. LESSONS LEARNED: Scheme is ongoing, with more locations continually being added. Lessons from previous implementations are being introduced for each one. RESULTS OF EVALUATION: Not yet available (due 2023) |
19/12/2022 | View |
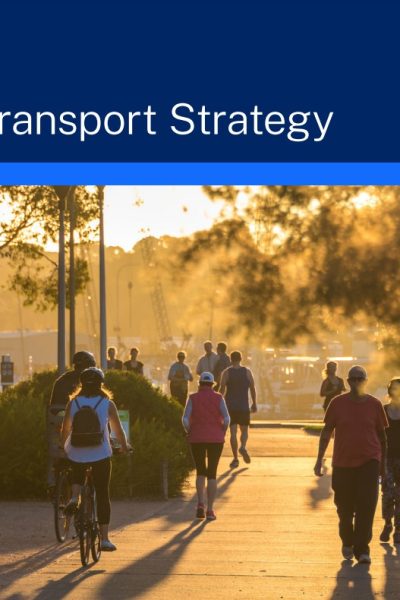 |
Active Transport Strategy Transport for NSW The NSW Government wants walking and bike riding, known as active transport, to be the preferred way to make short trips and a viable, safe and efficient option for longer trips. We estimate that more than 1.5 billion walking and bike riding trips are taken per year across New South Wales. We want to double this number in 20 years. NSW Government’s Future Transport Strategy sets the vision for safe, healthy, sustainable, accessible and integrated journeys in NSW. This Active Transport Strategy draws on the Future Transport Strategy and its vision for walking, bike riding and personal mobility. The Strategy provides a plan to guide planning, investment and priority actions for active transport across NSW. |
16/12/2022 | View |
|
Safer Speeds Case Study - Warnambool, Victoria STREET NAME: Liebig Street between Raglan Parade and Merri Street SUBURB: Warnambool MUNICIPALITY: City of Warrnambool STATE & COUNTRY: Victoria, Australia SPEED REDUCTION: From 40 km/h to 30 km/h DATE IMPLEMENTED: December 2019 SCHEME INCLUDED:
COST: Not available ADDITIONAL INFORMATION: The projects’ infrastructure has successfully created a welcoming pedestrian priority experience in the City Centre. From the data: Reduction in speed to under 30km/hr:
Liebig Street Crashes (2011-2015): Pedestrian - 4 (2 aged 70+), Car - 2, Bicycle - 1 Liebig Street Crashes (2016-2020) (*note construction was 2018/19 and COVID): Car - 2 Safe Systems Road Safety Rating Improvement: Liebig/Koriot- 114 to 87 and Liebig/Lava- 113.5 to 82 WHY?
LESSONS LEARNED: The scheme included signage only. With additional infrastructure calming measures such as curb extensions, speed bumps, intersection platforms, further speed reduction improvements would be expected. The choice control region for this study was not seen as ideal. |
06/10/2022 | |
|
Safer Speeds Case Study - Fitzroy & Collingwood, Victoria STREET NAME: Treatment area located between Alexandra Parade (north), Hoddle Street (east), Johnston Street (south) and Nicholson Street (west) SUBURB: Fitzroy and Collingwood MUNICIPALITY: City of Yarra, Melbourne STATE & COUNTRY: Victoria, Australia SPEED REDUCTION: From 40 km/h to 30 km/h DATE IMPLEMENTED: January 2020 (trial start October 2018) SCHEME INCLUDED:
COST: Not available ADDITIONAL INFORMATION:
Observations of pedestrian and cyclist activity were undertaken at a limited number of locations within the treatment and non-treatment areas during three days before the trial implementation and three days at 12 months into the trial. The small number of locations and survey days limits the ability for general conclusions. The data shows a 12.7% drop in pedestrian activity (largely driven by a single site) and a 27.8% increase in cycling activity. LESSONS LEARNED: For some members of the community there was confusion about how the pedestrian priority at the crossings worked, how to determine when to enter and how to exit the roundabout. There are feelings of frustration caused by inconvenience to the driving experience which are perceived to be caused by the Wombat Crossings. Intercept surveys at the Wombat Crossings found people using them thought they created a more convenient walking experience however there was still concern about understanding how the crossings worked and the expectations of people walking and people driving. Information about the benefits of the crossings and the expectations of all road users would assist the community to understand the role they play in creating a pedestrian priority city centre. |
06/10/2022 | |
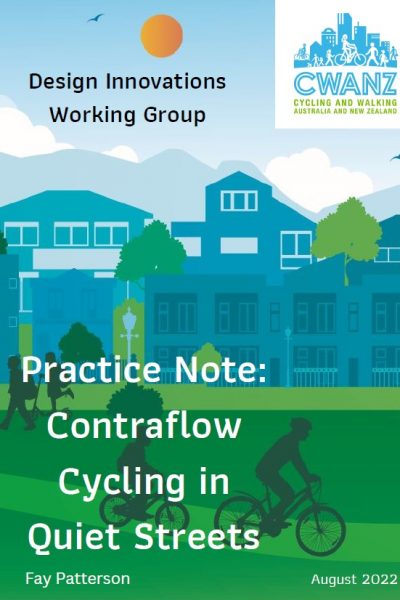 |
CWANZ Design Innovations Working Group Practice Note: Contraflow Cycling in Quiet Streets CWANZ The CWANZ Design Innovations Working Group undertook a review of contraflow cycling lanes in quiet streets. This report presents the evidence, technical advice, and implementation and design. Examples of streets with contraflow cycling lanes in Australia and New Zealand are given. |
06/10/2022 | View |
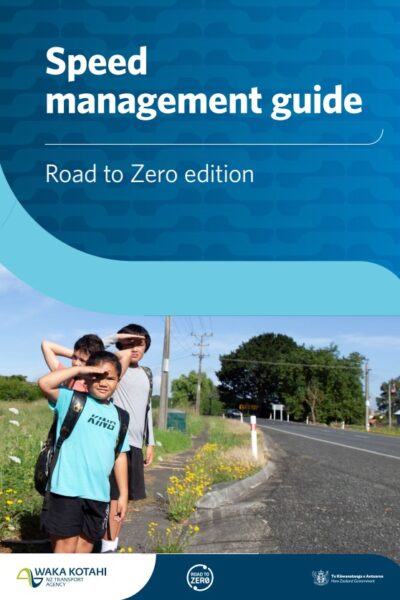 |
Speed management guide: Road to Zero Edition Waka Kotahi NZTA The Speed management guide: Road to Zero edition supports regional transport committees, regional councils and road controlling authorities |
12/08/2022 | View |
|
Safer Speeds Case Studies - Gold Coast, Queensland City of Gold Coast LOCATION: Cavill Avenue/Orchid Avenue, Surfers Paradise SPEED REDUCTION: Various – some 50 km/h to 40km/h, 50km/h to 30km/h and 40km/h to 30km/h MUNICIPALITY: City of Gold Coast STATE & COUNTRY: Queensland, Australia SCHEME INCLUDED:
DATE IMPLEMENTED: Various COST: Noted as low-cost initiative in the Gold Coast Road Safety Plan 2021-2026 ADDITIONAL INFO: General support and now going back to some 50km/h to 40km/h zones and undertaking further reviews to reduce to 30km/h LESSONS LEARNED:
|
19/07/2022 | View |
 |
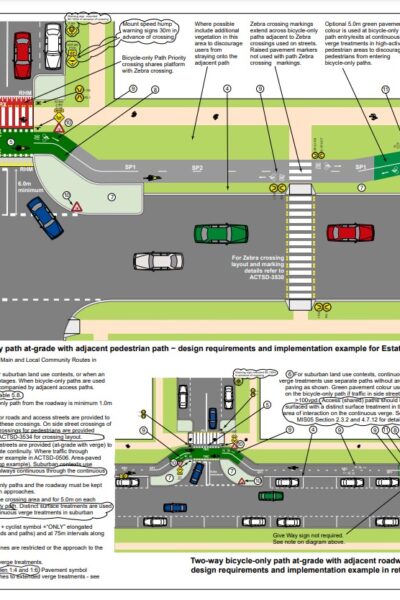
CWANZ Design Innovations Working Group: Use of Banana Deflection Rails CWANZ The CWANZ Design Innovations Working Group undertook a review of the use of banana deflection rails (banana bars) in Australia. In undertaking this review, they considered the Traffic and Road Use Management Volume1–Guide to Traffic Management Part 6: Intersections, Interchanges and Crossings (2020) prepared by the Queensland Department of Transport and Main Roads (TMR), and Municipal Infrastructure Standards (MIS) 05 – Active Travel Facilities Design, prepared by Transport Canberra City Services (TCCS). |
12/07/2022 | View |
 |
Municipal Design Standard Drawings Transport Canberra City Services The ACT Standard Drawings support the Municipal Infrastructure Design Standards and Technical Specifications. The Standard Drawings have been designed to be read in conjunction with the relevant referenced Municipal Infrastructure Standards (MIS) and Municipal Infrastructure Technical Specifications (MITS). The Standard Drawings provide detailed pictorial guidance for ACT civil assets, and reflects the most up-to-date industry practice. The design of and construction of municipal assets in the ACT must be in accordance with the Municipal Infrastructure Design Standards and Technical Specifications. Where any differences in practice exist between the Standard Drawings and the Municipal Infrastructure Standard, the later will prevail. |
08/07/2022 | View |
 |
Road Planning and Design Manual Department of Transport and Main Roads, Queensland The Road Planning and Design Manual is the Queensland Department of Transport and Main Roads' primary reference for the planning and design of roads. It refers designers to the relevant Austroads publications for technical requirements, and outlines where Queensland Department of Transport and Main Roads practice supplements or differs from the Austroads guides. |
08/07/2022 | View |
 |
Municipal Infrastructure Design Standards (MIS) Transport Canberra City Services The Municipal Infrastructure Standards (MIS) utilise the AusSpec document framework. This framework provides a level of design consistency across all local government jurisdictions in Australia, and reflects the most up-to-date industry practice. A number of local and regional government jurisdictions have adopted the AusSpec document framework as the primary technical framework for their design standards. |
08/07/2022 | View |
 |
Queensland Guide to Traffic Management Department of Transport and Main Roads, Queensland The Queensland Guide to Traffic Management (QGTM) is issued under the authority of Section 166 of the Transport Operations (Road Use Management) Act 1995. The contents of QGTM are issued as 'approved notices' under Section 166(2) of said Act. The Department of Transport and Main Roads has adopted Austroads' Guide to Traffic Management (AGTM) 2020 as part of national harmonisation. As a result, the QGTM will only provide requirements and recommendations specific to Queensland and has precedence over the equivalent Austroads Part. |
08/07/2022 | View |
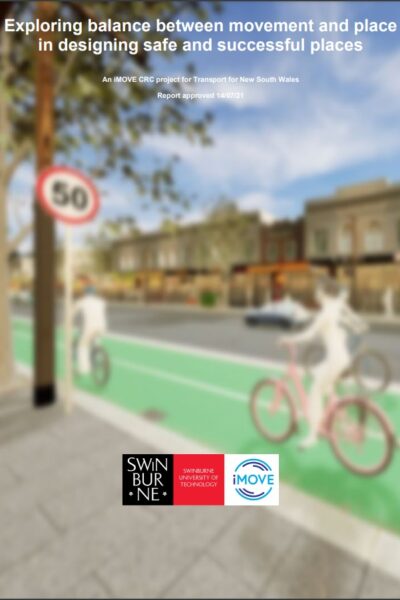 |
Movement & Place and the design of safe & successful places iMove Future Transport Strategy 2056 sets the 40-year vision and framework for customer mobility in NSW. As part of this vision, the Strategy recognises the importance of shaping our future transport spaces to ensure balance between movement and place. To support the development of successful places, the Movement & Place Framework promotes the urban design principles that allow local communities to come together in places with vehicle movement, thereby supporting social and economic growth. The purpose of this research is to use the Movement & Place Framework and Safe System approach to develop a series of evidence-based design principles and guidelines for balancing vehicle movement and place-making, to enhance the development of safe and successful places. Using virtual reality (VR) and pedestrian tracking technology, the project aims to better understand relationships between pedestrian-oriented urban design elemental variables and safe system treatments to improve the human experience and safety of pedestrians. Outcomes from this research will facilitate the implementation and evaluation of successful places in collaboration with local councils to determine the real-life impact of different place-making and safety variables. |
14/06/2022 | View |
 |
Movement and Place Transport for NSW Movement and Place is a cross-government framework for planning, designing and managing our transport networks to maximise benefits for the people and places they serve. |
14/06/2022 | View |
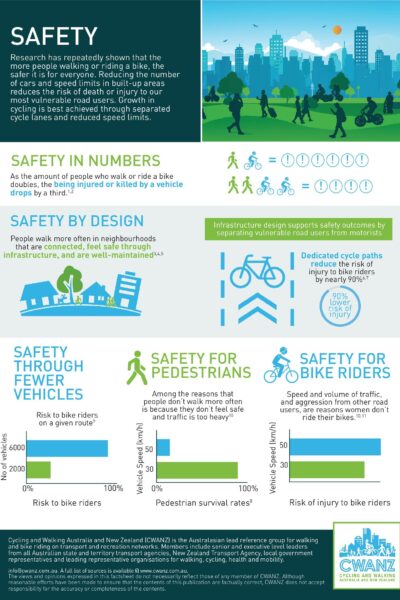 |
CWANZ Fact Sheet: Safety CWANZ Research has repeatedly shown that the more people walking or riding a bike, the safer it is for everyone. Reducing the number of cars and speed limits in built-up areas reduces the risk of death or injury to our most vulnerable road users. Growth in cycling is best achieved through separated cycle lanes and reduced speed limits. |
28/04/2022 | View |
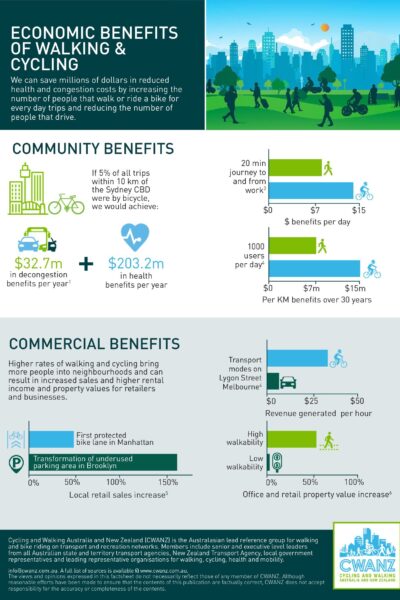 |
CWANZ Fact Sheet: Economic Benefits of Walking & Cycling CWANZ We can save millions of dollars in reduced health and congestion costs by increasing the number of people that walk or ride a bike for every day trips and reducing the number of people that drive. |
19/04/2022 | View |
 |
CWANZ Fact Sheet: Benefits of Lower Speed Limits CWANZ Benefits of lower speed limits in high activity areas and local access streets. What happens when vehicles travel more slowly in areas with lots of pedestrians and bike riders? |
19/04/2022 | View |
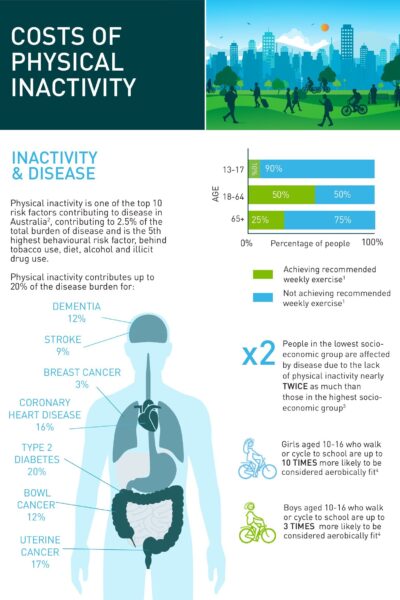 |
CWANZ Fact Sheet: Health Benefits of Active Transport CWANZ Physical inactivity is one of the top 10 risk factors contributing to disease in Australia, contributing to 2.5% of the total burden of disease and is the 5th highest behavioural risk factor, behind tobacco use, diet, alcohol and illicit drug use. |
19/04/2022 | View |
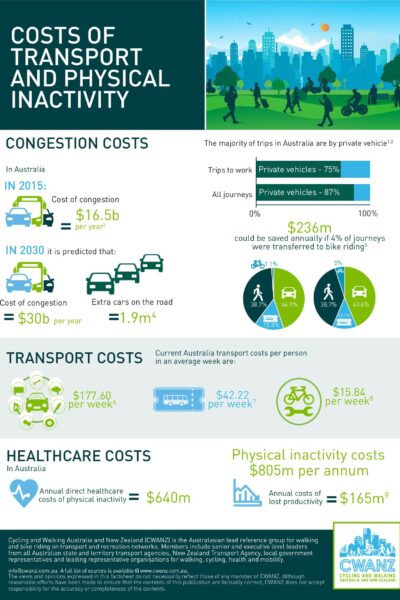 |
CWANZ Fact Sheet: Costs of Transport and Physical Inactivity CWANZ Congestion costs, transport costs and healthcare costs of physical inactivity. |
13/04/2022 | View |
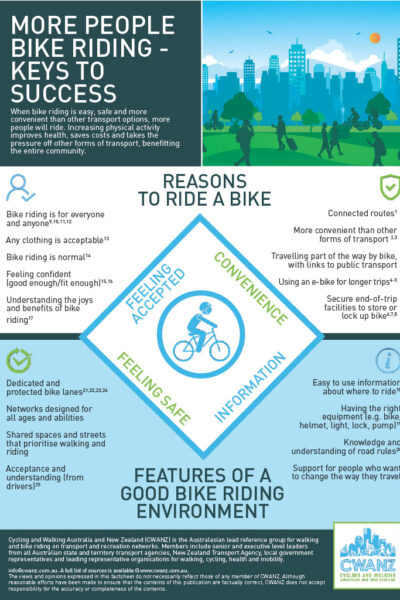 |
CWANZ Fact Sheet: More People Bike Riding - Keys to Success CWANZ When bike riding is easy, safe and more convenient than other transport options, more people will ride. Increasing physical activity improves health, saves costs and takes the |
13/04/2022 | View |
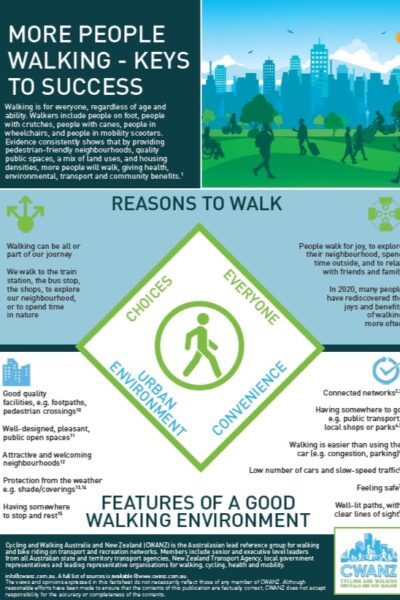 |
CWANZ Factsheet: More People Walking - Keys to Success CWANZ Walking is for everyone, regardless of age and ability. Walkers include people on foot, people with crutches, people with canes, people in wheelchairs, and people in mobility scooters. Evidence consistently shows that by providing pedestrian-friendly neighbourhoods, quality public spaces, a mix of land uses, and housing densities, more people will walk, giving health, environmental, transport and community benefits. |
13/04/2022 | View |
 |
NSW State Infrastructure Strategy Infrastructure NSW The State Infrastructure Strategy is a 20-year infrastructure investment plan for the NSW Government that places strategic fit and economic merit at the centre of investment decisions. The strategy assesses infrastructure problems and solutions, and provides recommendations to best grow the State's economy, enhance productivity and improve living standards for our NSW community. It is updated every five years. |
12/04/2022 | View |
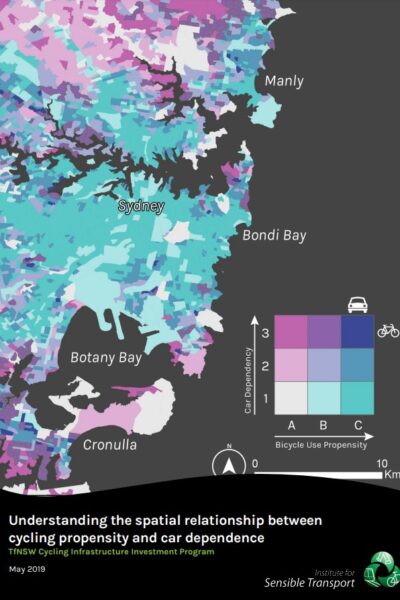 |
Cycling Propensity Transport for NSW This dataset contains the propensity index for cycling across different areas. It also contains the report that examines spatial relationship between areas with high propensity for cycling with high concentrations of short distance car trips. |
12/04/2022 | View |
|
Road rules for bicycle riders Transport for NSW |
12/04/2022 | View |
|
Active Transport to School Transport for NSW |
12/04/2022 | View |
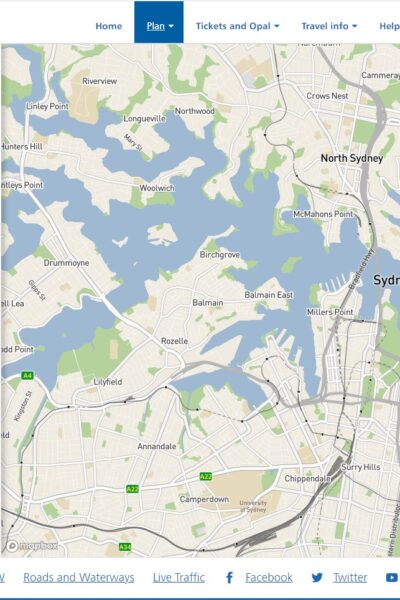 |
Trip Planner Transport for NSW |
12/04/2022 | View |
|
Bike It Baw Baw: Cyclist Safety Issues in the Baw Baw Shire Monash University Accident Research Centre The aim of the study was to identify the issues in Baw Baw Shire in Gippsland, Victoria, related to the safety of on-road cyclists. Safety concerns specific to the Baw Baw Shire are identified and potential countermeasures that may improve cyclist safety are discussed. |
12/04/2022 | View |
|
Cyclists and red lights – a study of the behaviour of commuter cyclist in Melbourne The National Academies of Sciences, Engineering, and Medicine The primary aim of this research was to investigate the behaviours of cyclists and their interactions with vehicles at signalised intersections.The results focus on the three types of behaviour at red lights. Males were more likely to continue through the red light than females and the majority of males who rode through red lights were runners. The findings are important as they differentiate between the types of red light running behaviour and highlight factors influencing cyclists risk exposure. |
12/04/2022 | View |
|
Cyclist bunch riding: a review of the literature Monash University Accident Research Centre This report is a review of the literature on cyclists who ride in large groups or bunches on public roads. The research was conducted following the Victorian State Coroner’s investigation into the death of an elderly pedestrian, following a collision with a cyclist who was riding in a bunch. The aims of the review were to understand the behaviour of bunch riders, particularly the behaviours that may contribute to increased risk of collision and to make recommendations for effective enforcement and countermeasure strategies for this road user group. |
12/04/2022 | View |
|
Naturalistic cycling study: identifying risk factors for on-road commuter cyclists Amy Gillett Foundation This study identified risk factors for collisions/near-collisions involving on-road commuter cyclists and drivers. A naturalistic cycling study was conducted in Melbourne, Australia, with cyclists wearing helmet-mounted video cameras. Video recordings captured cyclists’ perspective of the road and traffic behaviours including head checks, reactions and manoeuvres. |
12/04/2022 | View |
 |
Painting a designated space: cyclist and driver compliance at cycling infrastructure at intersections Amy Gillett Foundation This study evaluated cyclist and driver compliance at cycling infrastructure at signalised intersections to determine the effectiveness of the infrastructure in creating a designated space for cyclists. A cross-sectional observational study was conducted during peak travel times at six sites in Melbourne in March 2009. |
12/04/2022 | View |
|
The application of a naturalistic driving method to investigate on-road cyclist behaviour Amy Gillett Foundation The aim of this research was to investigate the behaviour of on-road commuter cyclists and their interactions with other road users in urban areas using a helmet-mounted video camera. Cycling is increasing in popularity popular in Australia; however, cyclists are physically vulnerable road users. To date, there has been little research on behavioural risk factors associated with collisions between cyclists and drivers, and much has relied on post-event data. Absent from this approach is an understanding of what contributed to collisions and near-collisions, in particular the behaviour of cyclists and drivers. |
12/04/2022 | View |
|
Bicycle helmet use, an excerpt from – Cyclist safety: an investigation of how cyclists and drivers interact on the roads Amy Gillett Foundation The use of bicycle helmets by cyclists is widely supported amongst the injury prevention and health promotion communities. |
12/04/2022 | View |
|
Cyclist safety: an investigation of how cyclists and drivers interact on the roads Monash University Cyclists are vulnerable road users and the most severe injury outcomes for on-road cyclists are from collisions involving a motor vehicle. Research undertaken in this thesis aimed to identify contributing factors in unsafe cyclist-driver events to inform efforts to reduce the incidence of cyclist-driver crashes and cyclist injury severity outcomes. |
12/04/2022 | View |
 |
Riding through red lights: The rate, characteristics and risk factors of non-compliant urban commuter cyclists Accident Analysis & Prevention This study determined the rate and associated factors of red light infringement among urban commuter cyclists. A cross-sectional observational study was conducted using a covert video camera to record cyclists at 10 sites across metropolitan Melbourne, Australia from October 2008 to April 2009. |
12/04/2022 | View |
 |
Making bike safety research count Amy Gillett Foundation Given the lack of participation data and the underreporting of cyclist injury crashes, it is difficult to determine the magnitude of cyclist road trauma with any precision. This lack of data highlights the neglect in Australia of cyclist-focused monitoring that is essential to understanding injury rates and factors that contribute to cyclist crashes. The Amy Gillett Foundation (AGF) has developed a systematic policy development approach that identifies two issues: safe overtaking distances and cyclist-open vehicle door crashes, explored in this paper. |
12/04/2022 | View |
 |
MACCS Monash Alfred cyclist crash study Monash University Accident Research Centre Current primary data sources on mechanisms of Victorian bicycle crashes lack sufficient detail to draw clear conclusions on crash causation. Nor are these data adequate to link specific crash mechanisms to characteristic injury outcomes. The Monash Alfred Cycle Crash Study (MACCS) aimed to redress these data deficiencies through piloting an in-depth crash investigation study focused on cyclists. In-depth data were collected from 158 patients presenting to The Alfred and Sandringham Hospital Emergency Departments who were riders of bicycles involved in a crash. Information collected covered pre-crash factors pertaining to environment and cyclist/driver behaviour, crash mechanism, and injury outcomes from hospital records. Analyses of these data provide insight on crash causation and associated injury burdens which can inform the development, prioritisation and targeting of effective countermeasures. |
12/04/2022 | View |
|
Why do cyclists infringe at red lights? An investigation of Australian cyclists’ reasons for red light infringement Accident Analysis & Prevention This study investigated the behavioural, attitudinal and traffic factors contributing to red light infringement by Australian cyclists using a national online survey. The survey was conducted from February to May 2010. In total, 2061 cyclists completed the survey and 37.3% reported that they had ridden through a signalised intersection during the red light phase. The main predictive characteristics for infringement were: gender with males more likely to offend than females (OR: 1.54, CI: 1.22–1.94); age with older cyclists less likely to infringe compared to younger cyclists 18–29 years (30–49 yrs: OR: 0.71, CI: 0.52–0.96; 50+ yrs: OR: 0.51, CI: 0.35–0.74), and; crash involvement with cyclists more likely to infringe at red lights if they had not previously been involved in a bicycle–vehicle crash while riding (OR: 1.35; CI: 1.10–1.65). The main reasons given for red light infringement were: to turn left (32.0%); because the inductive loop detector did not detect their bike (24.2%); when there was no other road users present (16.6%); at a pedestrian crossing (10.7%); and ‘Other’ (16.5%). A multinomial logistic regression model was constructed to examine the associations between cyclist characteristics and reasons for infringement. Findings suggest that some cyclists are motivated to infringe by their perception that their behaviour is safe and that infrastructure factors were associated with infringement. Ways to manage this, potentially risky, behaviour including behaviour programmes, more cyclist-inclusive infrastructure and enforcement are discussed. |
12/04/2022 | View |
 |
Road crashes involving bike riders in Victoria, 2002–2012 Amy Gillett Foundation This study is a multi-year analysis of bicycle rider crash statistics undertaken using Victorian CrashStats. It clearly shows that there are distinct differences in the crash profiles of fatal bike rider crashes compared to non-fatal crashes. |
12/04/2022 | View |
 |
Bike Law Amy Gillett Foundation A bike rider’s guide to road rules in Victoria. This guide outlines the essential road rules you need to know as a bike rider. |
12/04/2022 | View |
 |
Cycling Futures University of Adelaide Press The growing interest in cycling in Australia and New Zealand, as in other parts of the world, is underpinned by three major concerns: health and fitness, congestion and liveability, pollution and climate change. Australasian researchers, practitioners, policy makers and community members are engaged in a global discussion on the role of cycling in addressing these concerns. Contributors to (this) book report on and extend this discussion as they explore the insights generated locally and internationally on the past, present and future of cycling. The focus of the first half of the book is largely on the current engagement with cycling, challenges faced by existing and would-be cyclists and the issues cycling might address. The second half of the book is concerned with strategies and processes of change. Contributors working from different ontological positions reflect on changing socio-spatial relations to enable the broadest possible participation in cycling. |
12/04/2022 | View |
 |
Cycle Safe Communities Amy Gillett Foundation Cycle Safe Communities provides community groups, councils and organisations access to cycle safety campaign resources. Developed by the Amy Gillett Foundation, Cycle Safe Communities enables consistent messaging about bike rider safety to be adopted and embedded in the Australian community. Everyone has the right to ride safely for work and play. A safer future is possible! |
12/04/2022 | View |
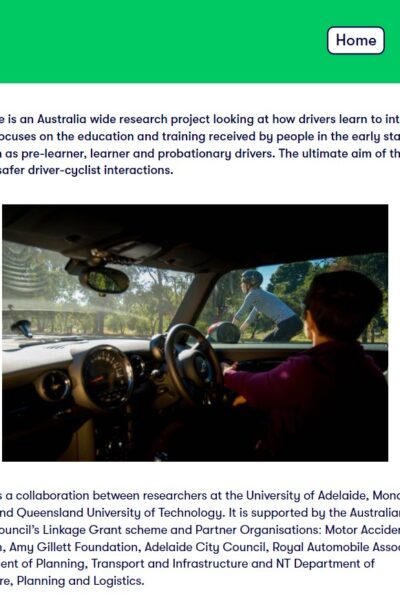 |
Cycle Aware University of Adelaide, Monash University and Queensland University of Technology Cycle Aware is an Australia wide research project looking at how drivers learn to interact with cyclists. It focuses on the education and training received by people in the early stages of driving such as pre-learner, learner and probationary drivers. The ultimate aim of the project is to foster safer driver-cyclist interactions. |
07/04/2022 | View |
 |
Sharing Roads Safely: Vulnerable Road User Training Amy Gillett Foundation Sharing Roads Safely is a training course developed suitable for heavy vehicle drivers to increase safe interactions with vulnerable road users, specifically motorbike riders, cyclists and pedestrians. Based on international best practice, the course was developed in consultation with the government, the heavy vehicle industry and vulnerable road user groups for drivers in Australia. Sharing Roads Safely is a recognised training course and meets compliance requirements for vulnerable road user awareness training.
|
07/04/2022 | View |
 |
BikeSpot CrowdSpot and the Amy Gillett Foundation Victoria is still striving to become a world-class cycling location. A lack of safety is the major barrier to people getting on their bikes. How it feels to ride a bicycle has an impact on people's willingness to ride. BikeSpot 2020 provides the opportunity for all Victorians to share their perceptions of cycling safety and help develop new insights for the prioritisation of cycling safety improvements. |
07/04/2022 | View |
 |
Travel planning toolkit guidelines and resources Waka Kotahi NZ Transport Agency The Waka Kotahi NZ Transport Agency travel planning toolkit provides you with guidelines and resources to make business trips and staff travel to and from work more efficient. You will find links to many resources to help you develop your workplace travel plan. |
07/04/2022 | View |
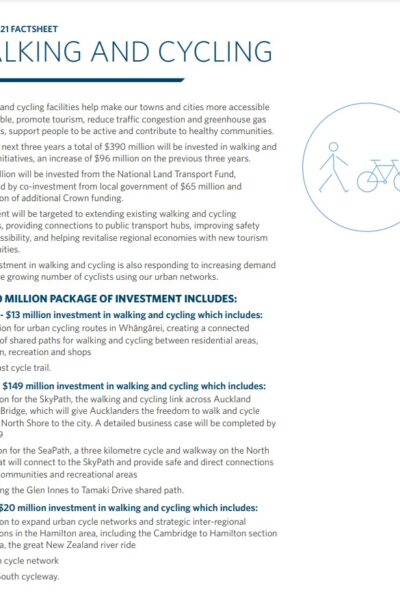 |
Walking and Cycling Improvements Waka Kotahi NZ Transport Agency Walking and cycling facilities help make cities and towns more liveable and support tourism. During 2018–21 about $390 million will be invested in walking and cycling initiatives, which will extend networks across the country and improve connections to a range of transport choices. This will improve safety and accessibility, and make a significant contribution to the revitalisation of town and city centres. Improvments will be made to walking and cycling facilities along state highway corridors up and down the country, as part of our state highway improvement programme. This includes landscaping, new bridges and underpasses to establish safe routes to encourage more people to walk or cycle. |
07/04/2022 | View |
 |
Research Report 667 Developing methodologies for improving customer levels of service for walking Waka Kotahi NZ Transport Agency This research was commissioned as there is currently a gap in terms of national models and tools that provide customer levels of service information regarding the walkability of New Zealand’s transport networks. The research aimed to determine the key factors that contribute to the quality and attractiveness of the pedestrian network, and to incorporate those in a consistent framework to inform the planning, design and operation of transport systems. The report contains a Pedestrian Level of Service (PLOS) Framework that is applicable for network, street and journey assessments. |
07/04/2022 | View |
 |
Research report 452 Predicting walkability Waka Kotahi NZ Transport Agency This research provides a number of mathematical formulas for predicting the quality of the walking environment from the perspective of the user using operational and physical variables. The formulas were derived by combining the perception data gathered from participants in the community street reviews with measurements of the walking environment. The two main areas that were researched to enable the derivation of formulas were:
This research describes the process for obtaining the data and deriving the formulas, and recommends the formulas most suitable for practitioner use. |
07/04/2022 | View |
 |
Research report 440 Reducing pedestrian delay at traffic signals Waka Kotahi NZ Transport Agency Since 2000, the benefits of walking as a mode of travel have been recognised by the New Zealand government in a raft of policy statements and strategies. However, the Ministry of Transport acknowledges that there are a number of issues to overcome to encourage more walking. This research focuses on one of the key issues: namely, the delay experienced by pedestrians at traffic signals. Historically, New Zealand's approach to pedestrian delay has been minimal, with pedestrian issues considered primarily from the point of view of safety, rather than level of service or amenity. At traffic signals, pedestrians are often accommodated in a way that causes the least amount of interruption to motorised traffic, and signal cycle times can be long, leading to excessive pedestrian waiting times. This can lead to frustration, causing pedestrians to violate the signals and use their own judgement to cross, resulting in safety risks. This research, which was carried out between 2007 and 2010 in Auckland, Wellington and Christchurch, used techniques such as pedestrian attitude surveys, micro-simulation modelling and a literature review of international best practice to identify methods of reducing pedestrian delay at signalised intersections in these cities. The recommendations developed during the course of the research provide both technical and policy mechanisms for improving pedestrian delay in New Zealand's central-city areas. |
07/04/2022 | View |
 |
Research Report 439 Generation of walking, cycling and public transport trips: pilot study Waka Kotahi NZ Transport Agency This research investigated a method for collecting data relating to walk, cycle and public transport trips to land-use activities. A method needed to be developed that would require a short questionnaire to ensure higher sample rates, while also providing reliable and consistent results. This data could subsequently be used in calculating trip rates for walk, cycle and public transport trips, when combined with trip rate units such as floor area. Multi-modal trip data has been collected for some time in the UK. The survey method developed in this research was simpler than the UK method by interviewing in only one direction for the vast majority of land uses, apart from residential where the recommended method was to interview in both directions. A face-to-face questionnaire method was developed over a series of different site surveys in Auckland, Wellington and Christchurch during 2010. The research also identified that collecting non-car mode trip information through purely observer methods was not sufficiently accurate and that simple questionnaire surveys were necessary with clear instructions from the survey organiser to ensure all relevant information would be collected. |
07/04/2022 | View |
 |
Research report 436 Benefits of new and improved pedestrian facilities - before and after studies Waka Kotahi NZ Transport Agency Walking is an essential mode of transport. New and improved pedestrian facilities promote walking and provide greater access and mobility within our communities. The NZ Transport Agency has recently updated the procedures for the evaluation of pedestrian improvement projects. The benefit factor applying to new pedestrian trips was increased from $0.50 to $2.70/km, making pedestrian facility improvement projects more economically viable. Thus, estimating the increase in pedestrian flows (as opposed to simply recording existing pedestrian flows) is now important in the economic evaluation of new or improved facilities. This research analysed case studies at eight New Zealand sites where the implementation of new pedestrian facilities (or the improvement of existing facilities) led to increased pedestrian usage and improved perception of the sites. The study recorded pedestrian rates both before and after facility implementation, and analysed accompanying factors such as safety, delay and directness. It also tried to develop an expected pedestrian-usage model, based on before and after data analysis, for planners and funding agents to use when planning new or improved facilities, and for use in project evaluation. Finally, a monitoring database containing before and after pedestrian count data for various new and improved pedestrian facilities, along with a list of the accompanying factors mentioned above, was developed for future use. |
07/04/2022 | View |
 |
Research Report 435 Walking and cycling: improving combined use of physical activity/health and transport data Waka Kotahi NZ Transport Agency SPARC's Active New Zealand Survey (ANZS) is a high-quality nationwide survey of over 4000 adults collected through face-to-face interviews over 12 months in 2007/08. Although collected mainly to measure levels of sport/recreation activity and to quantify physical activity in general, it includes data of interest to the transport sector on walking and cycling.
|
07/04/2022 | View |
 |
Research Report 431 The mechanisms and types of non-motor vehicle injuries to pedestrians in the transport system and indicated infrastructure implications Waka Kotahi NZ Transport Agency Research carried out in 2008-2010 examined the quantum and causes of non-motor vehicle injuries to pedestrians through a structured interview survey. Pedestrians sustaining injuries in locations away from the road network (eg in parks) were excluded, as the emphasis was on the role of road and footpath features. The highest proportion of trips and falls (34%) was sustained while stepping over a kerb. A further 18% were caused by irregularities in the path or road surface. Factors that amplified the severity of injuries included the road or path surface, pedestrians' inattention, type of footwear worn, and whether walking or running. Two main issues were identified from the study. These were:
The study recommends improving the definition of kerbing in key pedestrian areas and improving the maintenance regime of footpaths and roads used by pedestrians, eg crossings. The study also found that it is necessary to instigate research to provide improved data and analysis tools to prioritise such countermeasures vis-a-vis other uses of road safety funds and improved data for input into such analysis tools. Further, a national guide is needed for pedestrian road safety audits and inspections covering both motor vehicle and non-motor vehicle risk. |
07/04/2022 | View |
 |
Research report 428 Trialling pedestrian countdown timers at traffic signals Waka Kotahi NZ Transport Agency The overall research objective was to evaluate changes in pedestrian safety and traffic efficiency from installing pedestrian countdown timers. The study analysed pedestrian behaviour and safety before and after the installation of a trial countdown timer at the intersection of Queens Street, Bunny Street and Margaret Street in Lower Hutt in July 2007. The results were compared with the 2006/07 trial at the Queen Street/Victoria Street intersection in Auckland CBD and showed very different results. The Auckland city trial indicated that, if placed in suitable locations, pedestrian countdown signals were associated with pedestrian behaviour change that enhanced safety. This study in Lower Hutt demonstrated that the observed pedestrian safety decreased as the percentage of both late starters and late finishers increased, although this was likely to be due to the nature of the intersection with one particularly long diagonal crossing coupled with the allocated phase times. In contrast, perceived pedestrian safety increased with the installation of the countdown timers. |
07/04/2022 | View |
 |
Research Report 359 Valuing the health benefits of active modes Waka Kotahi NZ Transport Agency This report seeks to provide a per-kilometre value for the health benefits of active transport modes (such as walking and cycling) that is compatible with the Land Transport New Zealand Economic Evaluation Manual Volume 2 (EEM2). The first two sections of the report begin by explaining the scope of the project and the background. Section 3 investigates the evidence of the connection between physical activity and health outcomes. Section 4 clarifies the role of active transport modes as physical activity, and reports the New Zealand-specific data about active transport mode engagement. Section 5 gives a brief comparative summary of the literature review of cost-benefit analyses and valuation techniques used overseas to value the health benefits of active modes. This report uses population attributable fractions (PAF) to estimate the annual burden of mortality and morbidity costs per inactive adult. Annual estimates of the costs of inactivity are applied to the New Zealand adult population using a weighted sum to establish a per-kilometre value for each mode. The valuation presented in this report is limited by a poverty of data, but the final values are considered to be a reasonable estimate of the health benefits of active modes. While further research is recommended to obtain more precise estimates of the costs of inactivity in New Zealand, it is considered that the values presented in this report are a sound interim estimate for inclusion in the EEM2. |
07/04/2022 | View |
 |
Research Report 329 Impediments to walking as a mode choice Waka Kotahi NZ Transport Agency Conducted in 2005, this study evaluates a case-control design of contrasts between walkers and drivers to address factors influencing the uptake of walking as a mode choice. With samples drawn from Auckland and Wellington, New Zealand, this research uses a 62-item survey to examine a number of factors: fear of crime; trip-chaining/car dependency; weather; distance/time; social pressure, fatigue and fitness, parking charges, enjoyment of walking, inconvenience, and geography. To avoid factors such as car dependency or the inability to walk, participants are selected because they live a short distance from public transport parking facilities. The group of drivers demonstrate an irregular break in car dependency by driving their cars to the station in order to use public transport. The results indicate that for parking facilities, convenience creates demand. Poor weather has an influence on the decision to drive, and fine weather improves the likelihood of walking. Previous studies claim decisions to walk are impeded by certain factors. While location effects are observed between the groups, these results suggest that such factors are in fact inconsequential. |
07/04/2022 | View |
 |
Research Report 294 Increasing cycling and walking: an analysis of readiness to change Waka Kotahi NZ Transport Agency In 2003, Sport and Recreation New Zealand (SPARC) and the Cancer Society of New Zealand commissioned a major social marketing survey to segment adult New Zealanders in terms of physical activity and healthy eating habits. The questionnaire included several transport-related questions. The resulting ‘Obstacles to Action’ database contains responses from over 8000 people aged 16 or over. |
07/04/2022 | View |
 |
Non-motorised user monitoring technology ViaStrada |
07/04/2022 | View |
 |
Monitoring Walking and Cycling: Creating Vibrant Towns and Cities Waka Kotahi NZ Transport Agency |
07/04/2022 | View |
 |
Programme/project logic models Waka Kotahi NZ Transport Agency The links provide different guides to developing programme/project logic models. |
07/04/2022 | View |
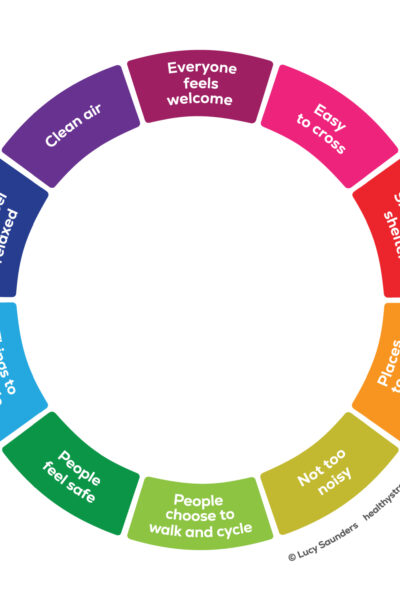 |
Healthy Streets Healthy Streets Towns and cities everywhere are facing the challenge of keeping communities healthy and happy. Healthy Streets® offers clients around the world an evidence-based approach to creating fairer, sustainable and attractive urban spaces. |
07/04/2022 | View |
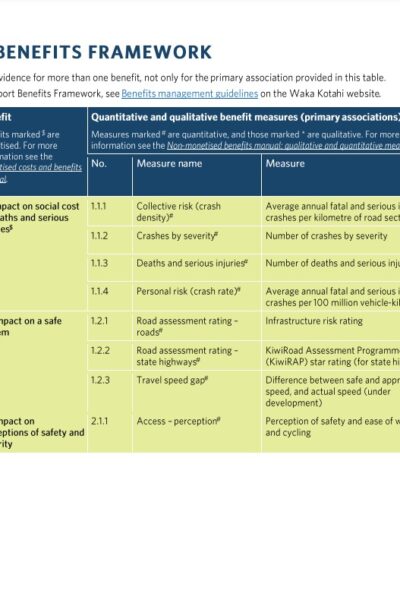 |
Benefits management guidance Waka Kotahi NZ Transport Agency This guidance is to help transport planners, business case writers and anyone involved in transport investment understand the Land Transport Benefits Framework and how to use benefits management in their work. |
07/04/2022 | View |
 |
Code of practice for temporary traffic management (CoPTTM: Part 8 of the Traffic Control Devices manual (TCD Manual) Waka Kotahi NZ Transport Agency This is the standard reference for all temporary traffic management on state highways and local roads. It includes levels of temporary traffic management, signs and forms used, and a series of sample traffic management plans. |
07/04/2022 | View |
 |
Land Transport Rule: Traffic Control Devices 2004 Waka Kotahi NZ Transport Agency This rule covers requirements for the design, construction, installation, operation and maintenance of traffic control devices, and functions and responsibilities of road controlling authorities. |
07/04/2022 | View |
 |
Traffic control devices manual (TCD manual) Waka Kotahi NZ Transport Agency The Traffic control devices manual (TCD manual) provides guidance on industry best practice, including, where necessary, practice mandated by law in relation to the use of traffic control devices. |
07/04/2022 | View |
 |
Land Transport (Road User) Rule 2004 Waka Kotahi NZ Transport Agency This rule establishes the rules under which traffic operates on roads. It applies to all road users, whether they are drivers, riders, passengers, pedestrians, or leading or droving animals. |
07/04/2022 | View |
 |
Tactical Urbanism Handbook Waka Kotahi NZ Transport Agency The draft Tactical Urbanism Handbook has been developed as a tool to help councils and communities deliver tactical urbanism projects to a high standard, using a collaborative best-practice approach. |
07/04/2022 | View |
 |
Streets for People Waka Kotahi NZ Transport Agency Creating a healthier future by putting people and place at the heart of our streets. |
07/04/2022 | View |
 |
Standard safety intervention toolkit Waka Kotahi NZ Transport Agency The Standard Safety Intervention toolkit provides guidance for road safety practitioners on the effectiveness and value-for-money cost range of proven safety interventions to reduce the number of people killed and seriously injured on Aotearoa roads. |
07/04/2022 | View |
 |
Safe walking and cycling treatments for intersections and crossings Waka Kotahi NZTransport Agency Waka Kotahi NZTransport Agency and the Transportation Group are hosting a series of free webinars focused on creating vibrant towns and cities. This webinar aims to introduce some of the current state-of-the-art thinking around these safety measures for our active modes. For more information on the ‘Creating vibrant towns and cities’ webinar series, visit www.nzta.govt.nz/creating-vibrant-towns-and-cities |
07/04/2022 | View |
 |
How to Talk About Urban Mobility and Transport Shift: A Short Guide, 2020 The Workshop This guide is designed for technical experts, communicators and advocates working to deliver urban mobility solutions that grow the share of travel by public transport, walking and cycling. Its purpose is to help us use more effective strategies to: improve people’s understanding, based on best evidence, of why a shift in transport modalities away from cars and towards active and public transport is needed; help people designing and leading the shift to have better conversations with the public; motivate people to act in support of these shifts. This guide is based on a literature review conducted by The Workshop on behalf of Waka Kotahi NZ Transport Agency. |
07/04/2022 | View |
 |
How to Talk about Urban Mobility: Narratives for Deeper Understandings Waka Kotahi NZ Transport Agency This webinar provides a theoretically driven, evidence-led framework so we can understand how to: ● improve people’s understanding, based on best evidence, of why a shift in transport modalities away from cars and towards active and public transport is needed ● help people designing and leading the shift to have better conversations with the public ● motivate people to act in support of these shifts. Part of the Creating vibrant towns and cities webinar series https://www.nzta.govt.nz/walking-cycling-and-public-transport/creating-vibrant-towns-and-cities-webinar-series/ |
07/04/2022 | View |
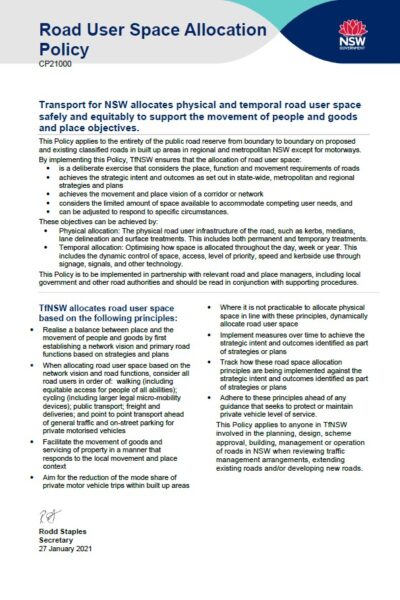 |
Providing for Walking and Cycling in Transport Projects Policy Transport for NSW Transport for NSW allocates physical and temporal road user space safely and equitably to support the movement of people and goods and place objectives |
07/04/2022 | View |
 |
Household Travel Survey (HTS) Transport for NSW The most comprehensive source of personal travel data for the Sydney Greater Metropolitan Area (GMA). Find out how and why people travel. |
07/04/2022 | View |
 |
Strategic Parking Management Waka Kotahi NZ Transport Agency Part of Urban Mobility & Liveable Cities Series. Presented by Lorelei Schmitt, Principal Multimodal Advisor, Waka Kotahi NZ Transport Agency and George Lyons |
07/04/2022 | View |
 |
System Change and Communications: Shifting the Dial Waka Kotahi NZ Transport Agency Part of Urban Mobility and Liveable Cities Series, presented by Kathryn King, Portfolio manager Developing Regions, Waka Kotahi NZ Transport Agency |
07/04/2022 | View |
 |
Healthy Streets Waka Kotahi NZ Transport Agency Part of Urban Mobility and Liveable Cities Series. Featuring Claire Pascoe (Waka Kotahi NZ Transport Agency), Hamish Mackie (Mackie Research) and Lemauga Lydia Sosense, Chair Mangere Otahuhu Local Board. |
24/11/2021 | View |
 |
Urban Mobility and Liveable Cities: Shaping Urban Form Waka Kotahi NZ Transport Agency |
19/10/2021 | View |
 |
Tactile Indicator Installation Note - webinar Waka Kotahi NZ Transport Agency This webinar is for anyone involved in the design, installation and construction supervision of tactile ground surface indicators (TGSIs/tactile paving). |
19/10/2021 | View |
 |
Tactile Indicator Installation Note Waka Kotahi NZ Transport Agency The purpose of this technical note is to provide some high-level recommended practice to contractors carrying out the installation of tactile pavers as requested in an industry survey in 2018. This is a supplementary publication aimed at roading and utility contractors to provide a simple guide for reinstating tactile pavers affected by their works. |
19/10/2021 | View |
 |
RTS14 Guidelines for facilities for blind and vision impaired pedestrians Waka Kotahi NZ Transport Agency RTS 14 is the official guide that ensures that design and operation of roads and paths caters for blind and vision impaired pedestrians. It also takes into account the needs of people with impaired mobility. It provides detailed requirements for a continuous accessible path, tactile ground surface indicators and audible tactile traffic signal features. |
19/10/2021 | View |
|
Bridging the Gap: NZTA Urban Design Guidelines Waka Kotahi NZ Transport Agency The guidelines seek to improve the understanding of what good urban design means in a transport project. The guidelines are intended for consultants, contractors, project managers, stakeholders and the community who participate in the planning, design, construction and maintenance of our transport networks. They are also intended for other Transport Agency staff whose work and actions affect urban design outcomes. |
19/10/2021 | View |
 |
Pedestrian Planning and Design Guide Waka Kotahi NZ Transport Agency The Pedestrian planning and design guide is New Zealand's comprehensive official guide to planning and design for walking. It sets out ways to improve New Zealand’s walking environment |
19/10/2021 | View |
 |
Low-powered Vehicles Waka Kotahi NZ Transport Agency There is a range of low-powered devices that New Zealanders use for travel or recreation. While these vehicles and devices offer the benefit of increased mobility, they can also increase your safety risks on and around the road. |
19/10/2021 | View |
 |
NZ Road Code Information for Pedestrians Waka Kotahi NZ Transport Agency As a pedestrian, it’s important that you follow the road rules and guidelines. They will help ensure your safety when you’re walking near roads or crossing the road. |
19/10/2021 | View |
 |
NZ Road Code for Cyclists Waka Kotahi NZ Transport Agency |
19/10/2021 | View |
 |
Trials Underway and Rules Changes Waka Kotahi NZ Transport Agency Keeps the industry up to date with cycle design trials that are currently underway, or have been completed in recent years, and also what cycling-related rules are being reviewed and when |
19/10/2021 | View |
|
Designing a Cycling Facility Waka Kotahi NZ Transport Agency Provides users with best practice guidance, either directly or through links to appropriate sources for all stages of design, from concept stage through to detailed design |
19/10/2021 | View |
 |
Planning a Cycling Network Waka Kotahi NZ Transport Agency Provides users with best practice guidance, either directly or through links to appropriate sources for all stages of planning a cycle network |
19/10/2021 | View |
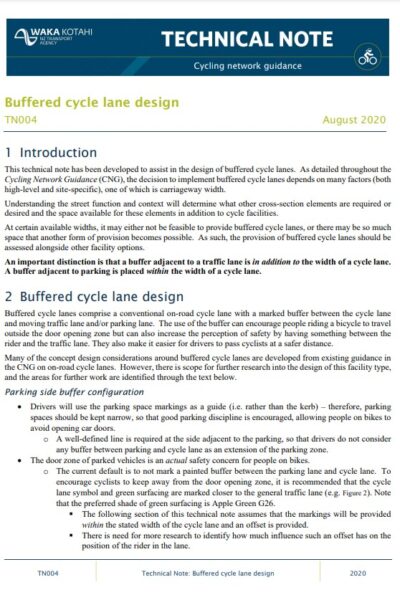 |
Technical note #4: Buffered Cycle Lane Design Waka Kotahi NZ Transport Agency Guidance on the design of buffered cycle lanes for varying carriageway widths |
19/10/2021 | View |
 |
Technical note #3: Cycle Count Scaling Spreadsheet Waka Kotahi NZ Transport Agency Describes scaling methodology and use of the Cycle count scaling spreadsheet tool, used to scale permanent and short-term count data for average daily cyclist values |
19/10/2021 | View |
 |
Technical note #2: Separated Cycleways at Side Roads and Driveways Waka Kotahi NZ Transport Agency This updated guidance covers how to design a priority-controlled cycle crossing of a side road or driveway |
19/10/2021 | View |
 |
Technical note #1: Separated Cycleway Options Tool Waka Kotahi NZ Transport Agency Guidance on use of the Separated cycleway options tool (SCOT), used to assist in the decision on whether to provide two 1-way facilities or a single 2-way facility on a particular route |
19/10/2021 | View |
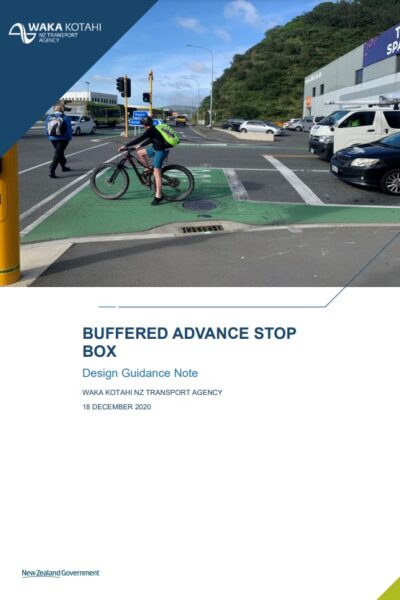 |
Buffered Advance Stop Box Waka Kotahi NZ Transport Agency Provides a treatment solution for advance stop boxes to improve visibility of cyclists from heavy vehicles and decrease the level of vehicle encroachment |
19/10/2021 | View |
 |
Access Control Devices Waka Kotahi NZ Transport Agency Guidance on the design, installation and management of access control devices on facilities where cyclists are permitted to be present. |
18/10/2021 | View |
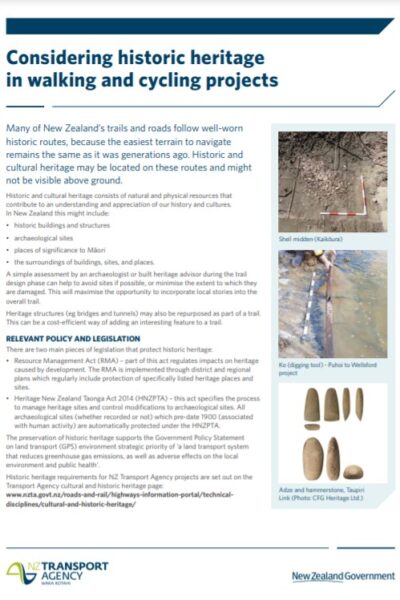 |
Considering Historic Heritage in Walking and Cycling Projects Waka Kotahi NZ Transport Agency The draft Handbook for tactical urbanism has been developed as a tool to help councils and communities deliver tactical urbanism projects to a high standard, using a collaborative best-practice approach. |
07/10/2021 | View |
 |
Draft Handbook for Tactical Urbanism in Aotearoa Waka Kotahi NZ Transport Agency The draft Handbook for tactical urbanism has been developed as a tool to help councils and communities deliver tactical urbanism projects to a high standard, using a collaborative best-practice approach. |
06/10/2021 | View |
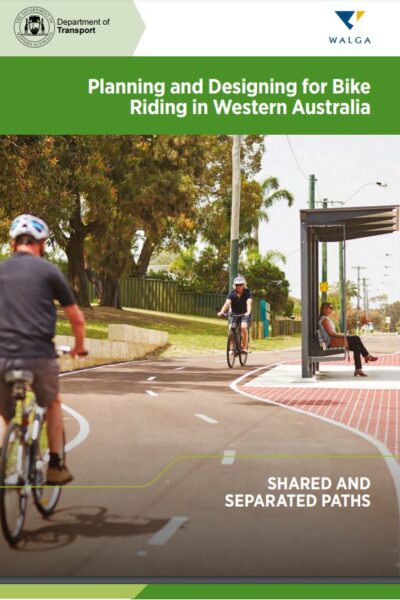 |
Shared and Separated Path Guidelines Department of Transport WA This document provides practitioners with guidance surrounding the planning and design of shared and separated paths in Western Australia to enable the safe and efficient movement of bicycle riders of all ages and abilities. It is intended to be a convenient and practical reference guide aimed at practitioners with varying levels of experience. |
06/10/2021 | View |
 |
Draft Handbook for tactical urbanism in Aotearoa - Guidance: roadway art Waka Kotahi NZ Transport Agency A supplement to the Handbook for tactical urbanism provides draft guidance on compliant application of using road artwork effectively and safely in New Zealand. |
30/09/2021 | View |
 |
High-use driveway treatment for cycle paths and shared paths Waka Kotahi NZ Transport Agency Provides a treatment solution for commercial and high-use access points on cycleways and shared paths. |
30/09/2021 | View |
 |
Cycle Parking Planning and Design Waka Kotahi NZ Transport Agency This guidance summarises best practice provision of parking and end-of-trip facilities for people who cycle. |
30/09/2021 | View |
 |
Signs and markings to designate paths for pedestrians and cyclists Waka Kotahi NZ Transport Agency Guidance on where and how to use markings and/or signs that designate paths for pedestrians and/or cyclists. |
30/09/2021 | View |
 |
Sharrow Markings Waka Kotahi NZ Transport Agency Guidance on the implementation of shared lane markings (‘sharrows’). |
30/09/2021 | View |
 |
Cycle Facility Cost Estimation Tool Waka Kotahi NZ Transport Agency Tool to calculate and compare the rough order cost of a range of cycle route, facility and signalised intersection options. |
24/09/2021 | View |
 |
Cycleway Separation Device Selection Matrix Waka Kotahi NZ Transport Agency Matrix comparing types of cycleway separation device, and issues to be considered. |
24/09/2021 | View |
 |
Cycle Count Scaling Spreadsheet Tool Waka Kotahi NZ Transport Agency Allows permanent and short-term count data to be scaled to average daily cyclist values. |
24/09/2021 | View |
 |
Separated Cycleway Options Tool Waka Kotahi NZ Transport Agency Tool to assist in the decision on whether to provide two 1-way facilities or a single 2-way facility on a particular route. |
21/09/2021 | View |
 |
Design Guidance for Pedestrian and Cycle Rail Crossings Waka Kotahi NZ Transport Agency Waka Kotahi NZ Transport Agency and KiwiRail have been leading the development of a design guide for pedestrian and cycleway treatment at level crossings. The guide will improve safety, usability, compliance, consistency and will simplify the design process. |
21/09/2021 | View |
 |
Cycling Network Guidance Waka Kotahi NZ Transport Agency Cycling network guidance – planning and design (CNG) framework aims to promote a consistent, best-practice approach to cycling network and route planning throughout New Zealand. |
06/09/2021 | View |
 |
Research Report 660: Factors affecting cycling levels of service Waka Kotahi NZ Transport Agency This report examines cyclists’ perceptions of cycle infrastructure levels of service and proposes an assessment methodology for evaluating the level of service provided by cycling facilities. |
03/09/2021 | View |
 |
National Walking and Cycling Participation Survey 2021 - NSW Cycling and Walking Australia and New Zealand The National Walking and Cycling Participation Survey provides insight into walking and cycling activity across Australia and is a successor to the National Cycling Participation Survey which was conducted biennially from 2011 to 2019. |
02/09/2021 | View |
 |
National Walking and Cycling Participation Survey 2021 - Final Report Cycling & Walking Australia and New Zealand The National Walking and Cycling Participation Survey (NWCPS) provides insight into walking and cycling activity across Australia and is a successor to the National Cycling Participation Survey which was conducted biennially from 2011 to 2019. |
02/09/2021 | View |
 |
National Walking and Cycling Participation Survey 2021 - WA Cycling and Walking Australia and New Zealand The National Walking and Cycling Participation Survey (NWCPS) provides insight into walking and cycling activity across Australia and is a successor to the National Cycling Participation Survey which was conducted biennially from 2011 to 2019. |
31/08/2021 | View |
 |
National Walking and Cycling Participation Survey 2021 - Victoria Cycling and Walking Australia and New Zealand The National Walking and Cycling Participation Survey (NWCPS) provides insight into walking and cycling activity across Australia and is a successor to the National Cycling Participation Survey which was conducted biennially from 2011 to 2019. |
31/08/2021 | View |
 |
National Walking and Cycling Participation Survey 2021 - Tasmania Cycling and Walking Australia and New Zealand The National Walking and Cycling Participation Survey (NWCPS) provides insight into walking and cycling activity across Australia and is a successor to the National Cycling Participation Survey which was conducted biennially from 2011 to 2019. |
31/08/2021 | View |
 |
National Walking and Cycling Participation Survey 2021 - SA Cycling and Walking Australia and New Zealand The National Walking and Cycling Participation Survey (NWCPS) provides insight into walking and cycling activity across Australia and is a successor to the National Cycling Participation Survey which was conducted biennially from 2011 to 2019. |
31/08/2021 | View |
 |
National Walking and Cycling Participation Survey 2021 - Queensland Cycling and Walking Australia and New Zealand The National Walking and Cycling Participation Survey (NWCPS) provides insight into walking and cycling activity across Australia and is a successor to the National Cycling Participation Survey which was conducted biennially from 2011 to 2019. |
31/08/2021 | View |
 |
National Walking and Cycling Participation Survey 2021 - ACT Cycling and Walking Australia and New Zealand The National Walking and Cycling Participation Survey (NWCPS) provides insight into walking and cycling activity across Australia and is a successor to the National Cycling Participation Survey which was conducted biennially from 2011 to 2019. |
31/08/2021 | View |
 |
National Walking and Cycling Participation Survey 2021 - NT Cycling and Walking Australia and New Zealand The National Walking and Cycling Participation Survey (NWCPS) provides insight into walking and cycling activity across Australia and is a successor to the National Cycling Participation Survey which was conducted biennially from 2011 to 2019. |
31/08/2021 | View |
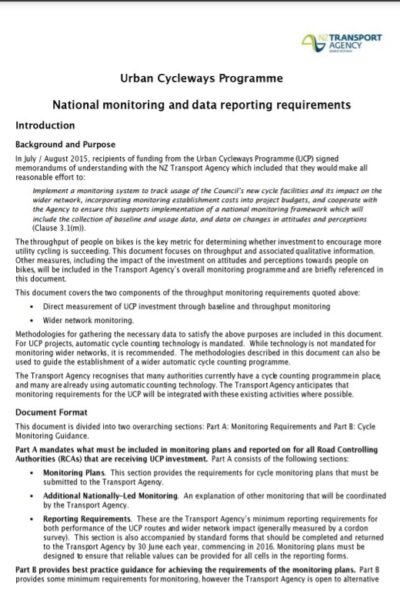 |
Urban Cycleways Programme: National monitoring and data reporting requirements Waka Kotahi NZ Transport Agency Outlines the national monitoring and reporting requirements for the Urban Cycleways Programme (UCP) projects. Includes best practice methodologies for measuring the success of new cycle infrastructure as well as wider network monitoring. |
18/08/2021 | View |
 |
Monitoring and Reporting Waka Kotahi NZ Transport Agency A description of the monitoring required, particularly once the implementation of the cycle network plan has started. |
18/08/2021 | View |
 |
Cycling Photo Library Waka Kotahi NZ Transport Agency Browse our collection of vibrant photos showcasing kiwi landmarks and everyday New Zealanders cycling in a variety of settings. |
18/08/2021 | View |
 |
Cycling Standards and Guidance Waka Kotahi NZ Transport Agency Cycling network guidance – planning and design (CNG) framework aims to promote a consistent, best-practice approach to cycling network and route planning throughout New Zealand. |
18/08/2021 | View |
 |
Workplace Cycling Guide Waka Kotahi NZ Transport Agency This online guide provides all the key information to help your workplace better provide for people on bikes. |
18/08/2021 | View |
 |
Journey Planner Waka Kotahi NZ Transport Agency |
13/08/2021 | View |
 |
Employer e-bike Purchase Support Schemes Waka Kotahi NZ Transport Agency Employer e-bike purchase support schemes are helping many more people to purchase e-bikes by addressing the key barrier of the upfront cost. They work through employers negotiating a discount from an e-bike supplier and then providing a wage advance or loan to staff, paid back through salary deductions over a set period. |
13/08/2021 | View |
 |
Research Report 621: Regulations and Safety for Electric Bicycles and Other Low-powered Vehicles Waka Kotahi NZ Transport Agency This research report presents a review of overseas legislation, technology trends, market and safety analyses for low-powered, low-speed vehicles. |
13/08/2021 | View |
 |
Cycling Skills and Training Waka Kotahi NZ Transport Agency A national cycling education system called BikeReady to increase the reach of cycling education in New Zealand. The system will improve quality and consistencies based on best practice, and, provide a monitoring and evaluation framework so we can assess how effective the system is at improving safety and encouraging more people to ride. |
12/08/2021 | View |
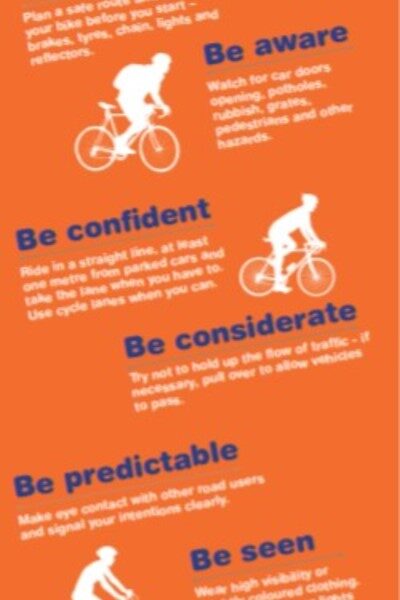 |
Cycle Safety Waka Kotahi NZ Transport Agency A few simple tips to stay safe when sharing the road. |
12/08/2021 | View |
 |
New Zealand Road Code for Cyclists Waka Kotahi NZ Transport Agency The official New Zealand code for cyclists is a user-friendly guide to New Zealand’s traffic law and safe cycling practices. |
12/08/2021 | View |
 |
Keeping Cities Moving Waka Kotahi NZ Transport Agency Waka Kotahi NZ Transport Agency has developed a plan to deliver on social, environmental and economic outcomes by growing the share of travel by public transport, walking and cycling (also known as mode shift). |
04/08/2021 | View |
 |
Sydney City Centre Access Strategy Transport for NSW The Sydney City Centre Access Strategy gets our city centre moving, addresses growth and will lead to increased investment for our future. |
03/08/2021 | View |
| NSW Regional Transport Plans Transport for NSW Major gains on key transport infrastructure and services for the region’s growing communities. Regions: |
03/08/2021 | View | |
| NSW Long Term Transport Master Plan Transport for NSW The NSW Long Term Transport Master Plan sets the framework for the NSW Government to deliver an integrated, modern transport system that puts the customer first. The Master Plan plays two fundamental roles. First, it identifies the challenges that the transport system in NSW needs to address to support the State’s economic and social performance over the next 20 years. It guides decision-makers to prioritise actions that address the most pressing challenges. |
03/08/2021 | View | |
 |
Walking and Cycling Program Guidelines Transport for NSW These guidelines outline the priority weighting system that will be used to assess walking and cycling proposals submitted to the NSW Government for funding. |
03/08/2021 | View |
 |
Sydney's Walking Future Transport for NSW The NSW Government’s goal is to get people in Sydney walking more through actions that make it a more convenient, better connected and safer mode of transport. The more people walk, the more socially engaged the community becomes and the safer people feel when walking for transport. |
03/08/2021 | View |
 |
Household Travel Survey Report: Sydney 2012/13 Transport for NSW Understand the travel behaviour and trends of the residents of Sydney Greater Metropolitan Area during 2012/2013, together with trends over the previous decade. |
03/08/2021 | View |
 |
Sydney Cycling Survey 2011 Transport for NSW The NSW 2021 strategic business plan establishes a target to more than double the mode share of cycling among trips up to 10 km in the Sydney Greater Metropolitan Area by 2016. In order to achieve this target, Roads and Maritime Services (RMS) and the Bureau of Transport Statistics (BTS) commissioned Sinclair Knight Merz to develop a survey method to monitor performance towards this target. This survey was first undertaken in November 2010 and as referred to as the Sydney Cycling Survey (SCS) 2010. |
03/08/2021 | View |
| Future Transport Transport for NSW Future Transport sets the direction for connecting people, communities and businesses in NSW to provide a successful and thriving future. |
03/08/2021 | View | |
 |
NSW Road Safety Strategy 2012-21 Transport for NSW The NSW Government is committed to improving road safety for the community and plans to make NSW roads the safest in the country. In 2011, we worked with the NSW Road Safety Advisory Council and the heavy vehicle industry to develop the NSW Road Safety Strategy 2012-2021. |
02/08/2021 | View |
 |
Cycle Route Directional Signage Example Department of Infrastructure, Energy and Resources An example of the process that can be used to map and plan the direction signs required to navigate along a cycle route. The example used is the Battery Point section of the Sandy Bay to Hobart and return route. |
30/07/2021 | View |
 |
Cycle Route Directional Signage Resource Manual Department of Infrastructure, Energy and Resources As part of the implementation of the Walking and Cycling for Active Transport Strategy 2010, this document aims to provide a resource for cycle infrastructure owners to utilise when developing and implementing directional signage for cycle routes. |
30/07/2021 | View |
 |
Move more, sit less Tasmanian Government The Move more, sit less campaign aims to raise awareness of the benefits of regular physical activity and minimising sedentary behaviour. |
30/07/2021 | View |
 |
Tasmanian Walking and Cycling for Active Transport Strategy Department of State Growth The Tasmanian Walking and Cycling for Active Transport Strategy is a key component of the Tasmanian Urban Passenger Transport Framework, which aims to promote walking and cycling as viable and desirable forms of transport through improved infrastructure, land use planning and behavioural change. The Strategy is intended to guide development of walking and cycling as transport options in our urban areas over the long-term by creating a more supportive transport system for pedestrians and cyclists. |
30/07/2021 | View |
 |
Towards Zero Tasmanian Road Safety Strategy 2017-2026 Department of State Growth In December 2016, the Government released the Towards Zero—Tasmanian Road Safety Strategy 2017-2026 (Towards Zero Strategy), Tasmania’s ten-year plan to reduce serious injuries and fatalities on our roads. |
23/07/2021 | View |
 |
Guide to Sharing Roads and Paths Transport Canberra and City Services The Australian Road Rules apply to road users in the ACT, including cyclists. The ACT's Road Transport (Safety and Traffic Management) Regulation 2000 provides some deviation from these, specific for cyclists in the ACT. |
22/07/2021 | View |
 |
Bike Barometer and Active Travel Data Transport Canberra and City Services A bike barometer has been located at the intersection of the Sullivan’s Creek shared path and MacArthur Avenue in O’Connor since November 2017. It counts the number of cyclists using a ground sensor. |
22/07/2021 | View |
 |
Active Commuting Transport Canberra and City Services Re-think your work journey to save time and money. Active travel is a great way to incorporate regular physical exercise into your daily routine. |
22/07/2021 | View |
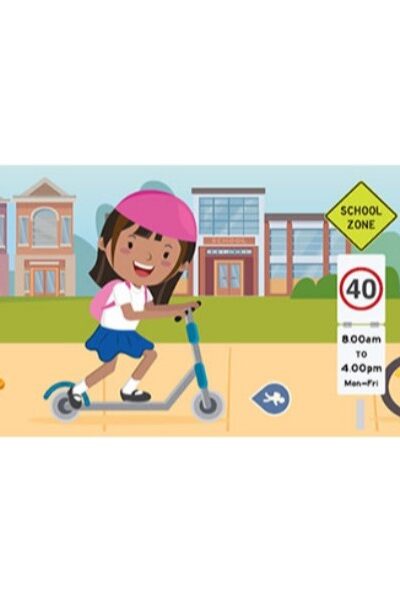 |
Active Travel Programs Transport Canberra and City Services School environments are busy during the morning and afternoon peak periods. The best way to reduce congestion and increase safety in these environments is to encourage more children to use active travel, which includes walking, riding or public transport. |
21/07/2021 | View |
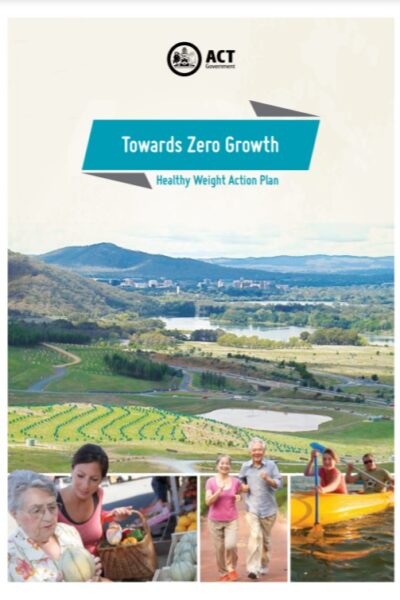 |
Towards Zero Growth: Healthy Weight Action Plan ACT Government Department of Health The action plan establishes local action to build on the work of the National Partnership Agreement on Preventive Health, the work of clinicians and nongovernment bodies, and on the many ACT programs already in place under our Healthy Weight Initiative. It will take the healthy weight agenda beyond the Health portfolio and improve coordination across government. |
21/07/2021 | View |
 |
City Plan ACT Government This City Plan sets a vision for future development in the city centre and was officially launched in March 2014. |
20/07/2021 | View |
 |
ACT Planning Strategy and Action Plan 2 (ACT Climate Change Strategy) Environment, Planning and Sustainable Development Directorate - Environment The ACT Climate Change Strategy 2019–2025 outlines the next steps the community, business and Government will take to reduce emissions by 50–60% (below 1990 levels) by 2025 and establish a pathway for achieving net zero emissions by 2045. |
20/07/2021 | View |
| Transport for Canberra Transport Canberra and City Services The strategy for transport planning in the ACT to 2031 |
19/07/2021 | View | |
| Building an Integrated Transport Network - Active Travel Transport Canberra and City Services The ACT Government's Building an Integrated Transport Network (the Active Travel Framework) recognises that walking and cycling are essential parts of Canberra's transport system. Through active travel initiatives, we're integrating walking and cycling into Canberra's overall urban planning, transport, health, environment and education systems. |
19/07/2021 | View | |
|
New Paths on New Projects Department of Transport, Victoria Every major new transport project – from North East Link to the West Gate Tunnel – now includes new or upgraded infrastructure for cyclists and pedestrians. |
16/07/2021 | View |
|
Active Transport Victoria Department of Transport, Victoria The Victorian Government has committed $15.3 million in the Victorian Budget 2019/20 towards Active Transport Victoria projects to deliver key upgrades for safer walking and cycling. |
16/07/2021 | View |
|
St Kilda Road Bike Lanes Department of Transport, Victoria St Kilda Road will soon be safer for everyone with new bike lanes to be built to separate drivers and cyclists. |
16/07/2021 | View |
|
Safer CBD Cycling Connections Department of Transport, Victoria 100kms of new and improved cycling routes across key inner-city suburbs to make it easier and safer for people to cycle to and from the CBD. |
16/07/2021 | View |
 |
Strategic Cycling Corridors Department of Transport, Victoria Strategic Cycling Corridors are important transport routes for cycling and are a subset of the Principal Bicycle Network. |
16/07/2021 | View |
 |
Victorian Road Safety Strategy 2021-2030 Department of Transport, Victoria The Victorian Road Safety Strategy 2021-2030 aims to halve deaths by 2030 and put us on a strong path to eliminate all road deaths by 2050. |
15/07/2021 | View |
| Sydney CBD to Parramatta Strategic Transport Plan Transport for NSW The Sydney CBD to Parramatta Strategic Transport Plan is a transport plan to improve the way people move along and around one of Sydney’s most important and busiest areas, the corridor between Sydney CBD and Parramatta. |
15/07/2021 | View | |
 |
Transport for NSW Economic Parameter Values Transport for NSW This document recommends economic parameter values for common benefits and costs in transport economic appraisals. By providing best-practice approaches and economic parameter values, this document supports the consistent application of cost-benefit analysis (CBA) across the NSW Transport cluster. |
15/07/2021 | View |
|
Economic Parameter Values Transport for NSW This spreadheet provides all tables in the Transport for NSW Economic Parameter Values. |
15/07/2021 | View |
 |
Way2Go Bike Education Department for Infrastructure and Transport, South Australia Bike education |
15/07/2021 | View |
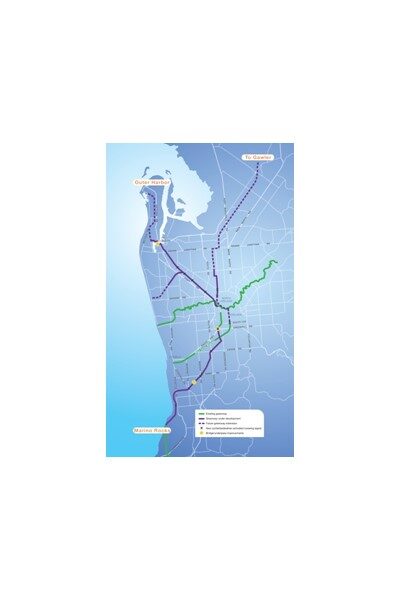 |
Greenways and Bike Boulevards Department for Infrastructure and Transport, South Australia Greenways are dedicated walking and cycling routes following public transport corridors or linear open space, such as along rivers. |
15/07/2021 | View |
 |
Cycling and Walking Maps Department for Infrastructure and Transport, South Australia Hard copy Cycling and Walking Maps will assist you to make active travel choices in Adelaide’s metropolitan suburbs. You can use the maps to plan safe walking or cycling routes to local shops, parks and services. |
15/07/2021 | View |
 |
Cycling and Public Transport Adelaide Metro Information on bikes and the public transport network. |
14/07/2021 | View |
|
Cyclist Road Rules and Safety Department for Infrastructure and Transport, South Australia While cyclists have the same rights and responsibilities as other road users, they are more vulnerable when travelling on the road. Both cyclists and motorists need to consider each other and share the road safely. |
14/07/2021 | View |
|
Cycling Grants Department for Infrastructure and Transport, South Australia South Australian local government councils can apply for the State Bicycle Fund. Applications are invited to be submitted early in the year for the following financial year's program. |
14/07/2021 | View |
 |
Cycle Instead Department for Infrastructure and Transport, South Australia Cycle Instead works as an interactive Journey Planner for your bike trip. It shows you the Bikedirect network across metropolitan Adelaide so you can quickly choose the most direct and comfortable route for your journey using secondary roads, bike lanes, shared paths, greenways and bicycle boulevards. |
13/07/2021 | View |
 |
Cycling Statistics Department of Infrastructure, Planning and Logistics, NT Cycling statistics in Darwin, Alice Springs and Super Tuesday bike commuter count for the Northern Territory. |
13/07/2021 | View |
 |
10 Year Infrastructure Plan 2019 Department of Infrastructure, Planning and Logistics, NT The reviewed Plan aims to help industry with its own planning and workforce management, and inform decision-making across all levels of government. Over the longer term, the Infrastructure Plan sets direction for planning and delivering infrastructure in the Northern Territory. |
13/07/2021 | View |
 |
Towards Zero Action Plan 2018-22 Department of Infrastructure, Planning and Logistics, NT This five-year road safety action plan focuses on key priority areas to reduce the rate of fatality and serious injury on Territory roads. |
12/07/2021 | View |
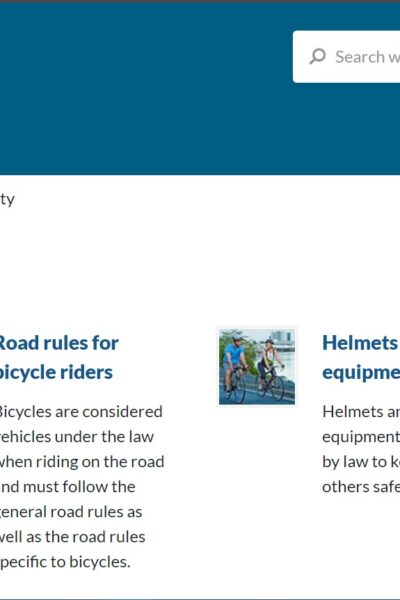 |
Cycling Safety Department of Transport and Main Roads, Queensland The rules for bicycle riders to keep everyone safe. |
09/07/2021 | View |
 |
Bike User Guide Department of Transport and Main Roads, Queensland Riding a bike is part of Queensland life. With a few tips and a bit of advice, it’s easy to get rolling. |
09/07/2021 | View |
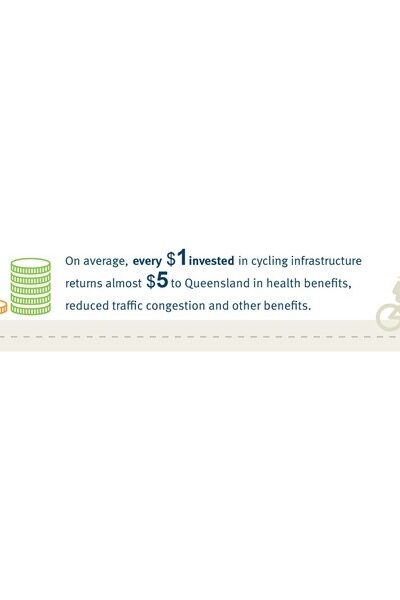 |
Economic Assessment of Cycling Department of Transport and Main Roads, Queensland Infographic showing the growth in cycling in conjunction with the investment in cycling infrastructure within inner Brisbane. |
09/07/2021 | View |
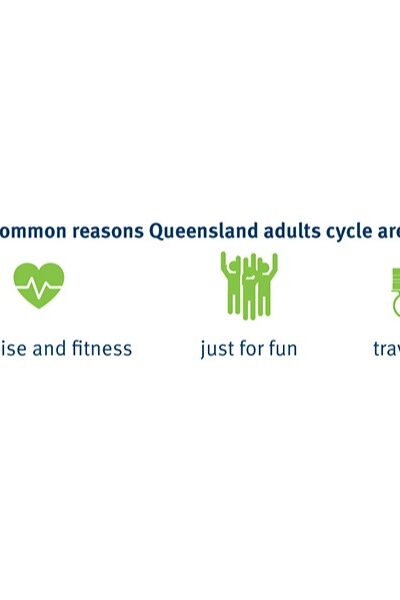 |
Benefits of Riding Department of Transport and Main Roads, Queensland Riding to work, school, uni or college, or taking your bike on short neighbourhood trips is a convenient and practical way to incorporate regular exercise into your busy day. |
09/07/2021 | View |
|
Cycling Infrastructure Grants Department of Transport and Main Roads, Queensland The Queensland Government is committed to achieving the Queensland Cycle Strategy 2017-2027 vision of ‘more cycling, more often on safe, direct and connected routes. The Department of Transport and Main Roads works with local governments to achieve this vision by delivering and improving principal cycle networks across Queensland. |
08/07/2021 | View |
 |
Bike Riding Encouragement Program Community Grants Program 2020-21 Department of Transport and Main Roads, Queensland The Bicycle Riding Encouragement Program (BREP) community grants provide financial support for activities that help to increase the number of people who regularly ride a bike. |
08/07/2021 | View |
 |
Principal Cycle Network Plans Department of Transport and Main Roads, Queensland Principal Cycle Network Plans show core routes needed to get more people cycling more often. Routes shown are indicative and exist to guide further planning. The plans are intended to support, guide and inform the planning, design and construction of the transport network. Read the Queensland Principal Cycle Network Update - Results of 2022 Community Consultation report to learn more about the consultation process and feedback received. |
08/07/2021 | View |
 |
Cycling Infrastructure Policy (Queensland) Department of Transport and Main Roads, Queensland The Cycling Infrastructure Policy is an important mechanism to deliver the Queensland Government’s vision for more cycling, more often and Transport and Main Roads’ vision of a single integrated transport system accessible to everyone. |
07/07/2021 | View |
|
Reporting a hazard or crash Department of Transport, WA Timely reporting of hazards from the community is vital to maintaining our cycling infrastructure. Find out what hazards to report and how to do so. |
07/07/2021 | View |
|
Bicycle rules, standards and safety (Western Australia) Department of Transport, WA Before starting to ride, bicycle riders should be familiar with bicycle standards and equipment, legislation for use of shared paths, roads, intersections and footpaths. |
07/07/2021 | View |
| Your Move Department of Transport, WA Your Move is an active lifestyle program that helps people find simple ways to get active and connected. Your Move offers information and support to make it easier to get active. |
07/07/2021 | View | |
 |
WA Bicycle Network Plan Department of Transport, WA The WABN Plan aims to make WA a place where cycling is safe, connected, and convenient and a widely accepted form of transport. |
06/07/2021 | View |
|
Safe Active Streets Program Department of Transport, WA An innovative program designed to make streets, friendlier and safer for all users including people in cars and those riding bikes and walking. |
06/07/2021 | View |
 |
Towards Zero Action Plan 2018-22 Towards Zero Road Safety Action Plan (Towards Zero) is a five year road safety action plan focuses on road safety actions to address the key priority areas for the Northern Territory. The Towards Zero Action Plan will work towards improving road safety in the Northern Territory. It will guide improvements in road safety, making all road users safer and reducing the rate of fatality and serious injury on Territory roads. |
20/05/2021 | View |
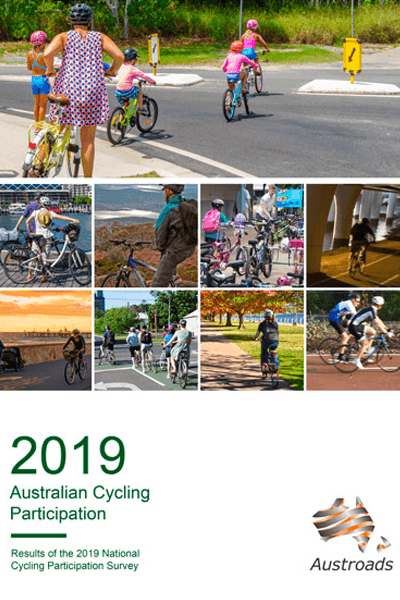 |
National Cycling Participation Survey (NCPS) Austroads The National Cycling Participation Survey (NCPS) is a standardised survey that has been repeated biennially since March/April 2011, with minor changes to the survey structure between 2011 and 2013. The NCPS provides data on cycling participation at a national level and allows for estimates of participation for each state and territory, and the capital cities and non-capital areas within each state and territory. |
20/05/2021 | View |
 |
Australasian Pedestrian Crossing Facility Selection Tool Austroads The Pedestrian Facility Selection Tool is designed to help Australian and New Zealand practitioners select the most appropriate type of pedestrian crossing based on walkability, safety and economic outcomes. |
20/05/2021 | View |
 |
Victorian Cycling Strategy 2019-2028 Department of Transport, Victoria The Victorian Cycling Strategy 2018-2028 is guiding planning and investment to get more people to cycle for transport – to work, school, public transport and shops – in Melbourne and the regions. |
20/05/2021 | View |
|
WA Bicycle Network Grants Program Department of Transport, WA The Western Australian Bicycle Network (WABN) Grants Program is an initiative of the Western Australian State Government, administered by the Department of Transport. |
20/05/2021 | View |
 |
Regional 2050 Cycling Strategies Department of Transport, WA The Department of Transport’s Regional 2050 Cycling Strategies aim to realise the cycling potential of regional Western Australia. |
18/05/2021 | View |
 |
Queensland Walking Strategy Department of Transport and Main Roads, Queensland Queensland’s first walking strategy recognises the critical role that walking plays as part of a single integrated transport system accessible to everyone and as part of a healthy, active lifestyle for all Queenslanders. Includes Queensland Walking Strategy 2019-2029, Action Plan for Walking, Walking in Queensland Report. |
18/05/2021 | View |
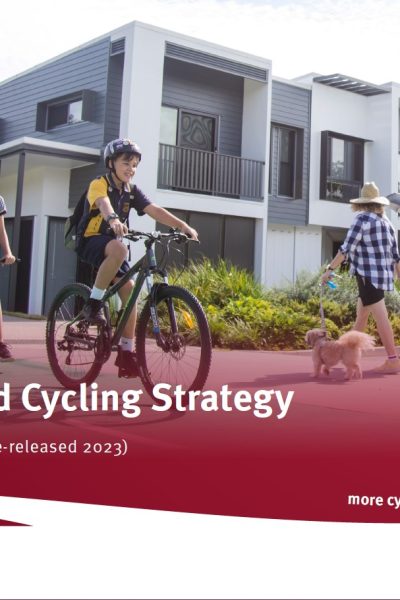 |
Queensland Cycling Strategy 2017-2027 Department of Transport and Main Roads, Queensland The Queensland Cycling Strategy 2017-2027 sets the strategic direction for cycling in Queensland over the next 10 years. The strategy identifies 5 priorities to achieve the Queensland Government's vision for 'more cycling, more often':
The strategy includes a 2-year action plan and report on the state of cycling in Queensland. |
18/05/2021 | View |
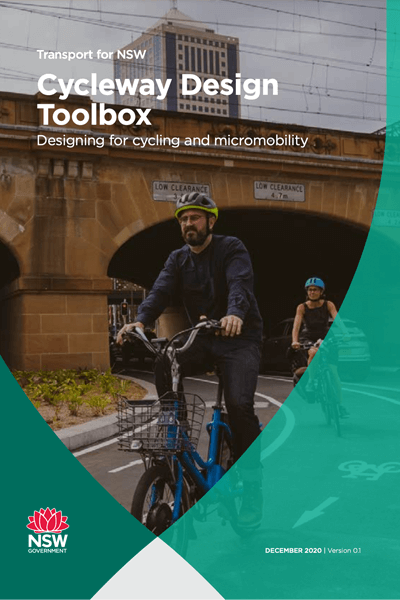 |
Cycleway Design Toolbox Transport for NSW Need description |
17/05/2021 | View |
 |
Walking Space Guide Transport for NSW The Walking Space Guide (Guide) provides a set of standards and tools to assist those responsible for Walking Spaces on streets, to ensure that sufficient space is provided to achieve comfortable environments which encourage people to walk. The Guide offers a clear, consistent set of standards and processes to be applied in designing, planning and implementing the amount of space to be provided according to the intensity of use. It is intended that designs are appropriate to the number of people using footpaths. This guide contains the method for carrying out a Walking Space assessment and offers guidance on how to understand the results. The guide includes an accompanying spreadsheet for recording data and calculating results. |
17/05/2021 | View |