Resources
This page contains some key resources on walking and cycling, including an archive of the documents produced by the Australian Bicycle Council.
| Date Added | |||
|---|---|---|---|
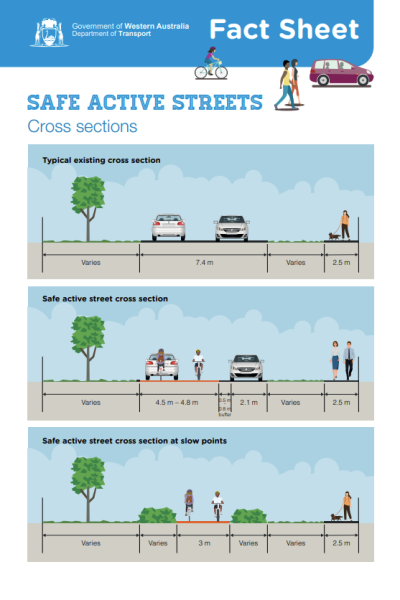 |
Safe Active Streets Pilot Program Department of Transport WA Department of Transport WA has been working with Western Australian local governments to develop, trial and evaluate ‘safe active streets’ which use local area traffic management treatments to encourage more people to walk, wheel and ride in their communities. |
18/03/2024 | View |
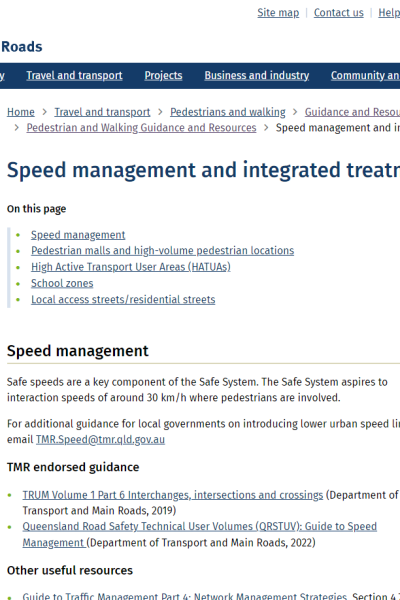 |
Speed management and integrated treatments Department of Transport and Main Roads, Queensland On this page: |
27/10/2023 | View |
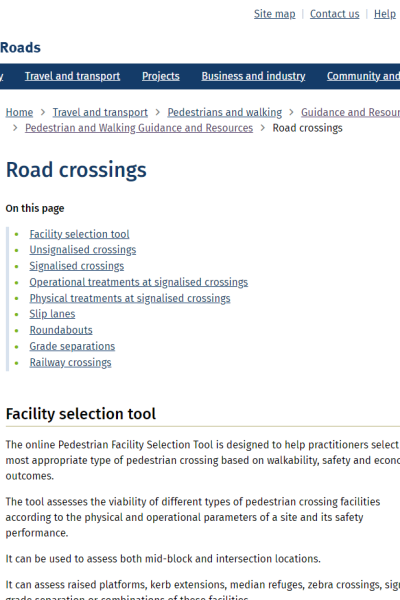 |
Road crossings Department of Transport and Main Roads, Queensland On this page: |
27/10/2023 | View |
 |
Speed zones Transport for NSW Speed limits are set to allow you to safely respond to potential risks on the road. Lower speed limits apply in areas where there are more people and vehicles. This is to reduce the chance of crashes and serious injuries. Includes:
|
22/09/2023 | View |
 |
Evaluation of permanent 40km/h speed limits: Summary report Transport for NSW |
17/05/2023 | View |
 |
40 km/h speed limits in high volume pedestrian areas Transport for NSW A guide to identifying and implementing 40 km/h speed limits in high volume pedestrian areas. |
15/05/2023 | View |
 |
Safer Speeds Case Study - Padbury, Western Australia STREET NAME: Local residential streets SUBURB: Padbury MUNICIPALITY: City of Joondalup STATE & COUNTRY: Western Australia, Australia SPEED REDUCTION: From 50 km/h to 30 km/h DATE IMPLEMENTED: NA SCHEME INCLUDED:
COST: Not available ADDITIONAL INFORMATION:
RESULTS OF EVALUATION: Not available |
28/02/2023 | |
 |
Safer Speeds Case Study - City of Yarra, Melbourne STREET NAMES: Treatment area located between Alexandra Parade (north), Hoddle Street (east), Johnston Street (south) and Nicholson Street (west) SUBURBS: Fitzroy and Collingwood MUNICIPALITY: City of Yarra, Melbourne STATE & COUNTRY: Victoria, Australia SPEED REDUCTION: From 40 km/h to 30 km/h DATE IMPLEMENTED: December 2019 SCHEME INCLUDED:
COST: Not available ADDITIONAL INFORMATION: Non-treatment area for control purposes located adjacent to the treatment area. WHY?
LESSONS LEARNED: The scheme included signage only. With additional infrastructure calming measures such as curb extensions, speed bumps, intersection platforms, further speed reduction improvements would be expected. The choice control region for this study was not seen as ideal. |
20/12/2022 | |
|
Safer Speeds Case Study - Wellington, New Zealand Wellington City Council STREET NAME: Most central city streets (not main through roads) SUBURB: Wellington COUNTRY: New Zealand SPEED REDUCTION: From 50 km/h to 30 km/h DATE IMPLEMENTED: June 2020.80% of roads within Wellington approved to have speeds recuced to 30 kph Septmber 2022 SCHEME INCLUDED:
COST: $NZ44.8 million (from September 2022) ADDITIONAL INFORMATION:
RESULTS OF EVALUATION: Not available |
20/12/2022 | View |
|
Safer Speeds Case Study - Auckland City Centre Auckland Transport STREET NAME: Multiple SUBURB: Auckland COUNTRY: New Zealand SPEED REDUCTION: Mostly from 50 km/h to 30 km/h DATE IMPLEMENTED: 30 June 2020 SCHEME INCLUDED:
COST: $NZ 49,297,544 (includes reduction of speed limits on all roads including urban and rural) ADDITIONAL INFORMATION:
LESSONS LEARNED:
RESULTS OF EVALUATION: Not available |
20/12/2022 | View |
 |
Safer Speeds Case Study - High Pedestrian Activity Areas, NSW Transport for NSW LOCATION: Multiple SUBURB: Multiple MUNICIPALITY: Multiple STATE & COUNTRY: New South Wales, Australia SPEED REDUCTION: Various to 40 km/h DATE IMPLEMENTED: 2003 SCHEME INCLUDED:
COST: Not available ADDITIONAL INFORMATION:
LESSONS LEARNED:
|
20/12/2022 | View |
|
Safer Speeds Case Study - Melbourne Shopping Strips Department of Transport, Victoria LOCATION: Multiple busy shopping strip centres SPEED REDUCTION: 50 km/h to 40km/h MUNICIPALITY: Multiple STATE & COUNTRY: Victoria, Australia SCHEME INCLUDED:
DATE IMPLEMENTED: Various COST: Not available ADDITIONAL INFORMATION: Introduced in areas of high pedestrian activity LESSONS LEARNED:
|
20/12/2022 | View |
|
Safer Speeds Case Study - Melbourne City of Melbourne STREET NAME: Local roads across inner Melbourne SUBURB: Melbourne MUNICIPALITY: City of Melbourne STATE & COUNTRY: Victoria, Australia SPEED REDUCTION: From 50 km/h to 40 km/h DATE IMPLEMENTED: September 2022 - ongoing SCHEME INCLUDED:
COST: Not available ADDITIONAL INFORMATION:
RESULTS OF EVALUATION: Not available |
19/12/2022 | View |
 |
Safer Speeds Case Study - Little Streets, Melbourne City of Melbourne STREET NAME: One-way sections of Flinders Lane, Little Collins Street, Little Bourke Street and Little Lonsdale Street SUBURB: Melbourne MUNICIPALITY: City of Melbourne STATE & COUNTRY: Victoria, Australia SPEED REDUCTION: From 40 km/h to 20 km/h DATE IMPLEMENTED: September 2020 SCHEME INCLUDED:
COST: Not available ADDITIONAL INFORMATION:
RESULTS OF EVALUATION: Not available |
19/12/2022 | View |
|
Safer Speeds Case Study - City of Charles Sturt, South Australia City of Charles Sturt STREET NAME: Multiple SUBURB: Multiple MUNICIPALITY: City of Chalres Sturt, Adelaide STATE & COUNTRY: South Australia, Australia SPEED REDUCTION: From 40 km/h to 30 km/h DATE IMPLEMENTED: 2012 SCHEME INCLUDED:
COST: $5,000-$10,000 ADDITIONAL INFORMATION:
LESSONS LEARNED:
RESULTS OF EVALUATION: Not available |
19/12/2022 | View |
|
Safer Speeds Case Study - City of Vincent, Perth City of Vincent STREET NAME: Local residential streets in the areas bounded by Newcastle, Vincent and Charles Streets and the Swan River (does not include main distributor roads) SUBURB: Southern suburbs of City of Vincent (Highgate, Mount Lawley) MUNICIPALITY: City of Vincent, Perth STATE & COUNTRY: Western Australia, Australia SPEED REDUCTION: From 50 km/h to 40 km/h DATE IMPLEMENTED: April 2019 SCHEME INCLUDED:
COST: Not available ADDITIONAL INFORMATION:
RESULTS OF EVALUATION: Not available |
19/12/2022 | View |
|
Safer Speeds Case Study - Fremantle, Western Australia City of Fremantle STREET NAME: Multiple (40 km/h zone) and South Terrace (30 km/h) SUBURB: Fremantle MUNICIPALITY: City of Fremantle STATE & COUNTRY: Western Australia, Australia SPEED REDUCTION: From 50 km/h to 40 km/h (zone) and 30 km/h (South Terrace) DATE IMPLEMENTED: July 2021 SCHEME INCLUDED:
COST: Not available ADDITIONAL INFORMATION: No formal evaluation or after studies to measure impact, however a lot of community support for lower speeds, particularly along South Terrace. LESSONS LEARNED: Used to test Main Roads WA new speed limit policy. RESULTS OF EVALUATION: Not available |
19/12/2022 | View |
|
Safer Speeds Case Study - Bayswater, Western Australia STREET NAME: Railway Parade and Whatley Crescent SUBURB: Bayswater MUNICIPALITY: City of Bayswater, Perth STATE & COUNTRY: Western Australia, Australia SPEED REDUCTION: From 50 km/h to 30 km/h DATE IMPLEMENTED: January 2020 (trial start October 2018) SCHEME INCLUDED:
COST: Not available ADDITIONAL INFORMATION: Temporary reduction while increased number of bike riders on road due to modifications to adjacent railway line and Principal Shared Path RESULTS OF EVALUATION: Not available |
19/12/2022 | |
|
Safer Speeds Case Study - Manly & Liverpool, NSW Transport for NSW STREET NAME: Multiple SUBURB: Manly and Liverpool MUNICIPALITY: Northern Beaches Council and Liverpool City Council STATE & COUNTRY: New South Wales, Australia SPEED REDUCTION: From 40 km/h to 30 km/h DATE IMPLEMENTED: July 2020 SCHEME INCLUDED:
COST: Not available RESULTS OF EVALUATION: Not available |
19/12/2022 | View |
|
Safer Speeds Case Study - Sydney CBD Transport for NSW STREET NAME: Multiple SUBURB: Sydney MUNICIPALITY: City of Sydney STATE & COUNTRY: New South Wales, Australia SPEED REDUCTION: From 50 km/h to 40 km/h DATE IMPLEMENTED: 2016, August 2019 SCHEME INCLUDED:
COST: Not available ADDITIONAL INFORMATION:
RESULTS OF EVALUATION: Not available |
19/12/2022 | View |
|
Safer Speeds Case Study - Brisbane Brisbane City Council STREET NAME: 1. Ann Street (between Creek Street and the Riverside Expressway); 2. Village precint:
3. Station Road, Indooroopilly 4. Flinders Parade, Sandgate 5. Kelvin Grove Urban Village SUBURB: Brisbane MUNICIPALITY: Brisbane City Council STATE & COUNTRY: Queensland, Australia SPEED REDUCTION: 1 & 2. From 60 km/h to 40 km/h 3-5. From 50 km/h to 40 km/h DATE IMPLEMENTED: 1. November 2018 2. May 2019 3 & 4. September 2019 5. Febraury 2020 SCHEME INCLUDED:
COST: Not available ADDITIONAL INFORMATION: LESSONS LEARNED: RESULTS OF EVALUATION: Not available |
19/12/2022 | View |
|
Safer Speeds Case Study - Fitzroy & Collingwood, Victoria STREET NAME: Treatment area located between Alexandra Parade (north), Hoddle Street (east), Johnston Street (south) and Nicholson Street (west) SUBURB: Fitzroy and Collingwood MUNICIPALITY: City of Yarra, Melbourne STATE & COUNTRY: Victoria, Australia SPEED REDUCTION: From 40 km/h to 30 km/h DATE IMPLEMENTED: January 2020 (trial start October 2018) SCHEME INCLUDED:
COST: Not available ADDITIONAL INFORMATION:
Observations of pedestrian and cyclist activity were undertaken at a limited number of locations within the treatment and non-treatment areas during three days before the trial implementation and three days at 12 months into the trial. The small number of locations and survey days limits the ability for general conclusions. The data shows a 12.7% drop in pedestrian activity (largely driven by a single site) and a 27.8% increase in cycling activity. LESSONS LEARNED: For some members of the community there was confusion about how the pedestrian priority at the crossings worked, how to determine when to enter and how to exit the roundabout. There are feelings of frustration caused by inconvenience to the driving experience which are perceived to be caused by the Wombat Crossings. Intercept surveys at the Wombat Crossings found people using them thought they created a more convenient walking experience however there was still concern about understanding how the crossings worked and the expectations of people walking and people driving. Information about the benefits of the crossings and the expectations of all road users would assist the community to understand the role they play in creating a pedestrian priority city centre. |
06/10/2022 | |
 |
Speed management guide: Road to Zero Edition Waka Kotahi NZTA The Speed management guide: Road to Zero edition supports regional transport committees, regional councils and road controlling authorities |
12/08/2022 | View |
|
Safer Speeds Case Studies - Gold Coast, Queensland City of Gold Coast LOCATION: Cavill Avenue/Orchid Avenue, Surfers Paradise SPEED REDUCTION: Various – some 50 km/h to 40km/h, 50km/h to 30km/h and 40km/h to 30km/h MUNICIPALITY: City of Gold Coast STATE & COUNTRY: Queensland, Australia SCHEME INCLUDED:
DATE IMPLEMENTED: Various COST: Noted as low-cost initiative in the Gold Coast Road Safety Plan 2021-2026 ADDITIONAL INFO: General support and now going back to some 50km/h to 40km/h zones and undertaking further reviews to reduce to 30km/h LESSONS LEARNED:
|
19/07/2022 | View |
 |
Queensland Guide to Traffic Management Department of Transport and Main Roads, Queensland The Queensland Guide to Traffic Management (QGTM) is issued under the authority of Section 166 of the Transport Operations (Road Use Management) Act 1995. The contents of QGTM are issued as 'approved notices' under Section 166(2) of said Act. The Department of Transport and Main Roads has adopted Austroads' Guide to Traffic Management (AGTM) 2020 as part of national harmonisation. As a result, the QGTM will only provide requirements and recommendations specific to Queensland and has precedence over the equivalent Austroads Part. |
08/07/2022 | View |
 |
CWANZ Fact Sheet: Benefits of Lower Speed Limits CWANZ Benefits of lower speed limits in high activity areas and local access streets. What happens when vehicles travel more slowly in areas with lots of pedestrians and bike riders? |
19/04/2022 | View |
|
Bike It Baw Baw: Cyclist Safety Issues in the Baw Baw Shire Monash University Accident Research Centre The aim of the study was to identify the issues in Baw Baw Shire in Gippsland, Victoria, related to the safety of on-road cyclists. Safety concerns specific to the Baw Baw Shire are identified and potential countermeasures that may improve cyclist safety are discussed. |
12/04/2022 | View |
|
Cyclists and red lights – a study of the behaviour of commuter cyclist in Melbourne The National Academies of Sciences, Engineering, and Medicine The primary aim of this research was to investigate the behaviours of cyclists and their interactions with vehicles at signalised intersections.The results focus on the three types of behaviour at red lights. Males were more likely to continue through the red light than females and the majority of males who rode through red lights were runners. The findings are important as they differentiate between the types of red light running behaviour and highlight factors influencing cyclists risk exposure. |
12/04/2022 | View |
|
Naturalistic cycling study: identifying risk factors for on-road commuter cyclists Amy Gillett Foundation This study identified risk factors for collisions/near-collisions involving on-road commuter cyclists and drivers. A naturalistic cycling study was conducted in Melbourne, Australia, with cyclists wearing helmet-mounted video cameras. Video recordings captured cyclists’ perspective of the road and traffic behaviours including head checks, reactions and manoeuvres. |
12/04/2022 | View |
 |
Painting a designated space: cyclist and driver compliance at cycling infrastructure at intersections Amy Gillett Foundation This study evaluated cyclist and driver compliance at cycling infrastructure at signalised intersections to determine the effectiveness of the infrastructure in creating a designated space for cyclists. A cross-sectional observational study was conducted during peak travel times at six sites in Melbourne in March 2009. |
12/04/2022 | View |
|
The application of a naturalistic driving method to investigate on-road cyclist behaviour Amy Gillett Foundation The aim of this research was to investigate the behaviour of on-road commuter cyclists and their interactions with other road users in urban areas using a helmet-mounted video camera. Cycling is increasing in popularity popular in Australia; however, cyclists are physically vulnerable road users. To date, there has been little research on behavioural risk factors associated with collisions between cyclists and drivers, and much has relied on post-event data. Absent from this approach is an understanding of what contributed to collisions and near-collisions, in particular the behaviour of cyclists and drivers. |
12/04/2022 | View |
|
Cyclist safety: an investigation of how cyclists and drivers interact on the roads Monash University Cyclists are vulnerable road users and the most severe injury outcomes for on-road cyclists are from collisions involving a motor vehicle. Research undertaken in this thesis aimed to identify contributing factors in unsafe cyclist-driver events to inform efforts to reduce the incidence of cyclist-driver crashes and cyclist injury severity outcomes. |
12/04/2022 | View |
 |
Riding through red lights: The rate, characteristics and risk factors of non-compliant urban commuter cyclists Accident Analysis & Prevention This study determined the rate and associated factors of red light infringement among urban commuter cyclists. A cross-sectional observational study was conducted using a covert video camera to record cyclists at 10 sites across metropolitan Melbourne, Australia from October 2008 to April 2009. |
12/04/2022 | View |
 |
Making bike safety research count Amy Gillett Foundation Given the lack of participation data and the underreporting of cyclist injury crashes, it is difficult to determine the magnitude of cyclist road trauma with any precision. This lack of data highlights the neglect in Australia of cyclist-focused monitoring that is essential to understanding injury rates and factors that contribute to cyclist crashes. The Amy Gillett Foundation (AGF) has developed a systematic policy development approach that identifies two issues: safe overtaking distances and cyclist-open vehicle door crashes, explored in this paper. |
12/04/2022 | View |
 |
MACCS Monash Alfred cyclist crash study Monash University Accident Research Centre Current primary data sources on mechanisms of Victorian bicycle crashes lack sufficient detail to draw clear conclusions on crash causation. Nor are these data adequate to link specific crash mechanisms to characteristic injury outcomes. The Monash Alfred Cycle Crash Study (MACCS) aimed to redress these data deficiencies through piloting an in-depth crash investigation study focused on cyclists. In-depth data were collected from 158 patients presenting to The Alfred and Sandringham Hospital Emergency Departments who were riders of bicycles involved in a crash. Information collected covered pre-crash factors pertaining to environment and cyclist/driver behaviour, crash mechanism, and injury outcomes from hospital records. Analyses of these data provide insight on crash causation and associated injury burdens which can inform the development, prioritisation and targeting of effective countermeasures. |
12/04/2022 | View |
|
Why do cyclists infringe at red lights? An investigation of Australian cyclists’ reasons for red light infringement Accident Analysis & Prevention This study investigated the behavioural, attitudinal and traffic factors contributing to red light infringement by Australian cyclists using a national online survey. The survey was conducted from February to May 2010. In total, 2061 cyclists completed the survey and 37.3% reported that they had ridden through a signalised intersection during the red light phase. The main predictive characteristics for infringement were: gender with males more likely to offend than females (OR: 1.54, CI: 1.22–1.94); age with older cyclists less likely to infringe compared to younger cyclists 18–29 years (30–49 yrs: OR: 0.71, CI: 0.52–0.96; 50+ yrs: OR: 0.51, CI: 0.35–0.74), and; crash involvement with cyclists more likely to infringe at red lights if they had not previously been involved in a bicycle–vehicle crash while riding (OR: 1.35; CI: 1.10–1.65). The main reasons given for red light infringement were: to turn left (32.0%); because the inductive loop detector did not detect their bike (24.2%); when there was no other road users present (16.6%); at a pedestrian crossing (10.7%); and ‘Other’ (16.5%). A multinomial logistic regression model was constructed to examine the associations between cyclist characteristics and reasons for infringement. Findings suggest that some cyclists are motivated to infringe by their perception that their behaviour is safe and that infrastructure factors were associated with infringement. Ways to manage this, potentially risky, behaviour including behaviour programmes, more cyclist-inclusive infrastructure and enforcement are discussed. |
12/04/2022 | View |
 |
Road crashes involving bike riders in Victoria, 2002–2012 Amy Gillett Foundation This study is a multi-year analysis of bicycle rider crash statistics undertaken using Victorian CrashStats. It clearly shows that there are distinct differences in the crash profiles of fatal bike rider crashes compared to non-fatal crashes. |
12/04/2022 | View |
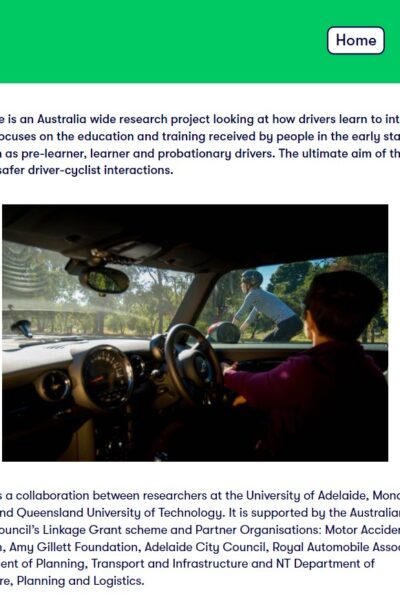 |
Cycle Aware University of Adelaide, Monash University and Queensland University of Technology Cycle Aware is an Australia wide research project looking at how drivers learn to interact with cyclists. It focuses on the education and training received by people in the early stages of driving such as pre-learner, learner and probationary drivers. The ultimate aim of the project is to foster safer driver-cyclist interactions. |
07/04/2022 | View |
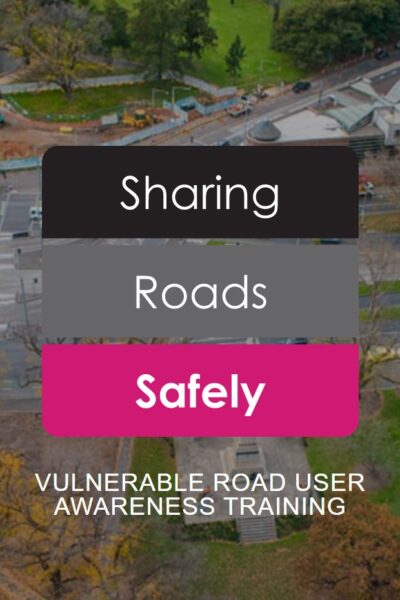 |
Sharing Roads Safely: Vulnerable Road User Training Amy Gillett Foundation Sharing Roads Safely is a training course developed suitable for heavy vehicle drivers to increase safe interactions with vulnerable road users, specifically motorbike riders, cyclists and pedestrians. Based on international best practice, the course was developed in consultation with the government, the heavy vehicle industry and vulnerable road user groups for drivers in Australia. Sharing Roads Safely is a recognised training course and meets compliance requirements for vulnerable road user awareness training.
|
07/04/2022 | View |
 |
BikeSpot CrowdSpot and the Amy Gillett Foundation Victoria is still striving to become a world-class cycling location. A lack of safety is the major barrier to people getting on their bikes. How it feels to ride a bicycle has an impact on people's willingness to ride. BikeSpot 2020 provides the opportunity for all Victorians to share their perceptions of cycling safety and help develop new insights for the prioritisation of cycling safety improvements. |
07/04/2022 | View |
 |
Code of practice for temporary traffic management (CoPTTM: Part 8 of the Traffic Control Devices manual (TCD Manual) Waka Kotahi NZ Transport Agency This is the standard reference for all temporary traffic management on state highways and local roads. It includes levels of temporary traffic management, signs and forms used, and a series of sample traffic management plans. |
07/04/2022 | View |
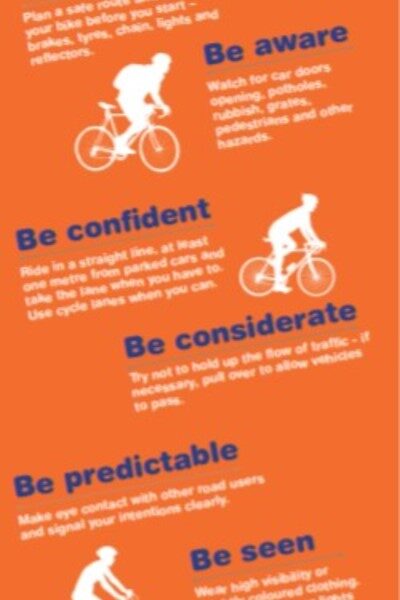 |
Cycle Safety Waka Kotahi NZ Transport Agency A few simple tips to stay safe when sharing the road. |
12/08/2021 | View |
 |
NSW Road Safety Strategy 2012-21 Transport for NSW The NSW Government is committed to improving road safety for the community and plans to make NSW roads the safest in the country. In 2011, we worked with the NSW Road Safety Advisory Council and the heavy vehicle industry to develop the NSW Road Safety Strategy 2012-2021. |
02/08/2021 | View |
 |
Towards Zero Tasmanian Road Safety Strategy 2017-2026 Department of State Growth In December 2016, the Government released the Towards Zero—Tasmanian Road Safety Strategy 2017-2026 (Towards Zero Strategy), Tasmania’s ten-year plan to reduce serious injuries and fatalities on our roads. |
23/07/2021 | View |
 |
Victorian Road Safety Strategy 2021-2030 Department of Transport, Victoria The Victorian Road Safety Strategy 2021-2030 aims to halve deaths by 2030 and put us on a strong path to eliminate all road deaths by 2050. |
15/07/2021 | View |
|
Cyclist Road Rules and Safety Department for Infrastructure and Transport, South Australia While cyclists have the same rights and responsibilities as other road users, they are more vulnerable when travelling on the road. Both cyclists and motorists need to consider each other and share the road safely. |
14/07/2021 | View |
 |
Towards Zero Action Plan 2018-22 Department of Infrastructure, Planning and Logistics, NT This five-year road safety action plan focuses on key priority areas to reduce the rate of fatality and serious injury on Territory roads. |
12/07/2021 | View |
 |
Towards Zero Action Plan 2018-22 Towards Zero Road Safety Action Plan (Towards Zero) is a five year road safety action plan focuses on road safety actions to address the key priority areas for the Northern Territory. The Towards Zero Action Plan will work towards improving road safety in the Northern Territory. It will guide improvements in road safety, making all road users safer and reducing the rate of fatality and serious injury on Territory roads. |
20/05/2021 | View |