Resources
This page contains some key resources on walking and cycling, including an archive of the documents produced by the Australian Bicycle Council.
| Date Added | |||
|---|---|---|---|
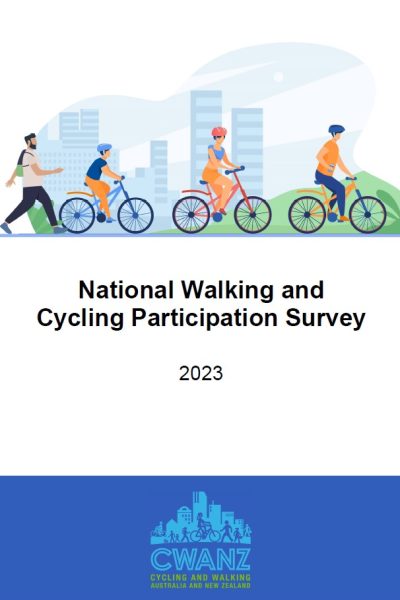 |
National Walking and Cycling Participation Survey 2023 CWANZ The National Walking and Cycling Participation Survey (NWCPS) provides insight into walking and cycling activity across Australia and is a successor to the National Cycling Participation Survey which was conducted biennially from 2011 to 2019. |
22/09/2023 | View |
 |
Disability Access and Inclusion Plan 2020-2022 Department for Infrastructure and Transport, South Australia The Disability Access and Inclusion Plan details the Department for Infrastructure and Transport’s commitment to promoting, protecting and enhancing the rights of people living with disability in South Australia. The Plan includes clear and measurable actions and targets designed through community and Departmental consultation to give effect to the priority areas of the first State Disability Inclusion Plan 2019-2023, as they relate to the purpose and activities of the Department. |
19/05/2023 | View |
 |
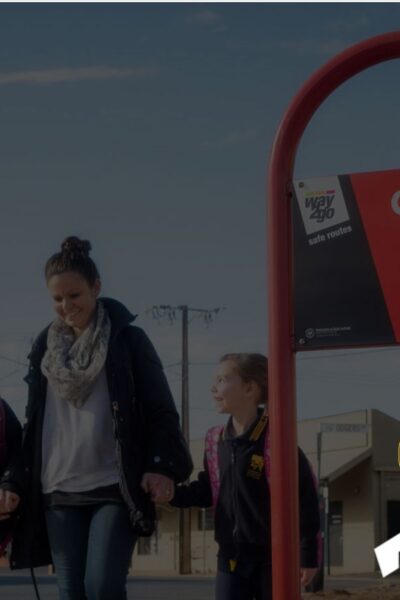
Active Travel to School Program: Way2Go Bike Ed Department for Infrastructure and Transport, South Australia PROGRAM FEATURES:
DATE IMPLEMENTED:
COST OF PROGRAM: Not available COST FOR USERS: Free for schools RESULTS OF EVALUATION: Report |
30/01/2023 | View |
|
Active Travel to School Program: Way2Go Department for Infrastructure and Transport, South Australia PROGRAM FEATURES:
DATE IMPLEMENTED: Commenced in 2005 as Safe Routes to School, re-branded to Way2Go in 2009 COST OF PROGRAM: Not available COST FOR USERS: Free for schools RESULTS OF EVALUATION: Not available |
30/01/2023 | View |
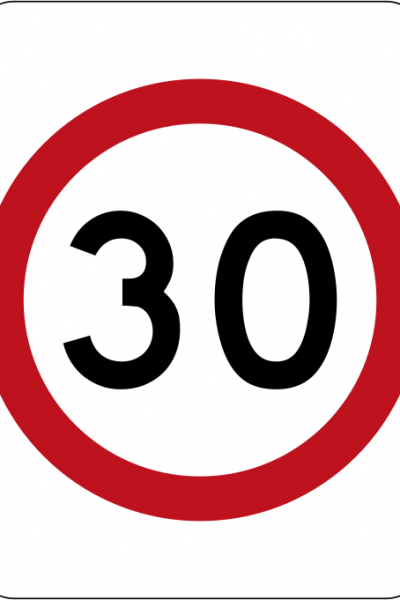 |
Safer Speeds Case Study - City of Charles Sturt, South Australia City of Charles Sturt STREET NAME: Multiple SUBURB: Multiple MUNICIPALITY: City of Chalres Sturt, Adelaide STATE & COUNTRY: South Australia, Australia SPEED REDUCTION: From 40 km/h to 30 km/h DATE IMPLEMENTED: 2012 SCHEME INCLUDED:
COST: $5,000-$10,000 ADDITIONAL INFORMATION:
LESSONS LEARNED:
RESULTS OF EVALUATION: Not available |
19/12/2022 | View |
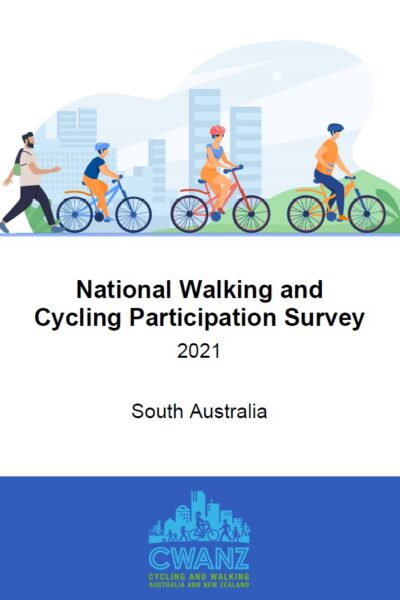 |
National Walking and Cycling Participation Survey 2021 - SA Cycling and Walking Australia and New Zealand The National Walking and Cycling Participation Survey (NWCPS) provides insight into walking and cycling activity across Australia and is a successor to the National Cycling Participation Survey which was conducted biennially from 2011 to 2019. |
31/08/2021 | View |
 |
Way2Go Bike Education Department for Infrastructure and Transport, South Australia Bike education |
15/07/2021 | View |
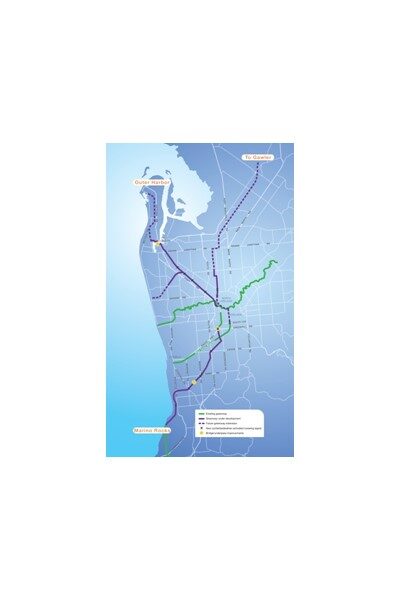 |
Greenways and Bike Boulevards Department for Infrastructure and Transport, South Australia Greenways are dedicated walking and cycling routes following public transport corridors or linear open space, such as along rivers. |
15/07/2021 | View |
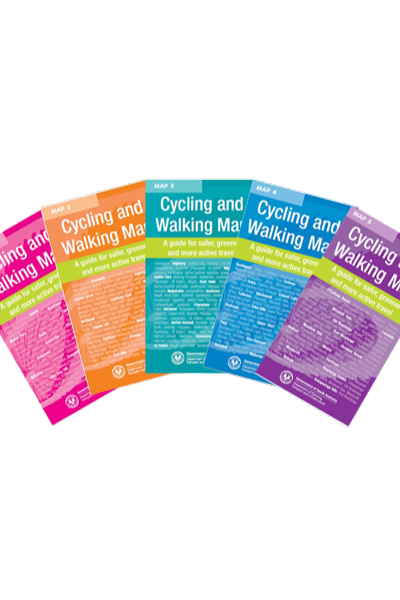 |
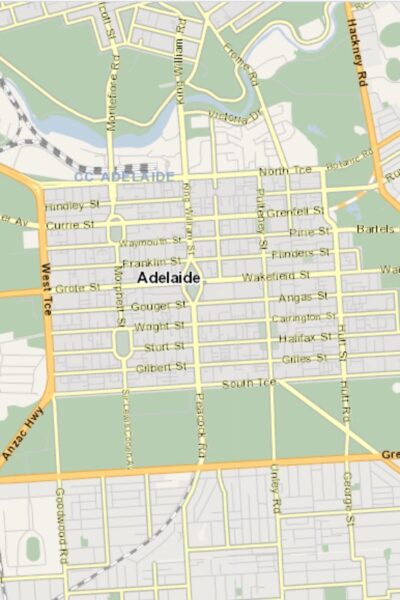
Cycling and Walking Maps Department for Infrastructure and Transport, South Australia Hard copy Cycling and Walking Maps will assist you to make active travel choices in Adelaide’s metropolitan suburbs. You can use the maps to plan safe walking or cycling routes to local shops, parks and services. |
15/07/2021 | View |
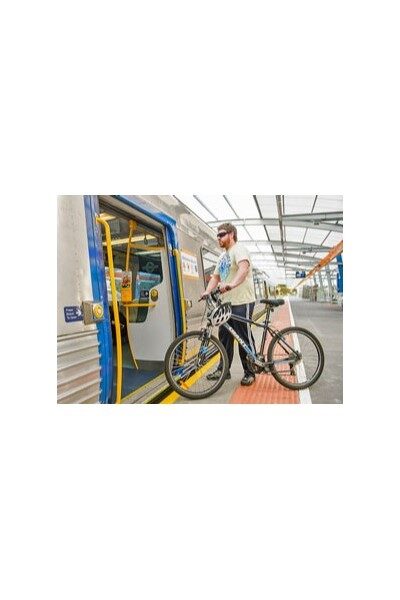 |
Cycling and Public Transport Adelaide Metro Information on bikes and the public transport network. |
14/07/2021 | View |
 |
Cyclist Road Rules and Safety Department for Infrastructure and Transport, South Australia While cyclists have the same rights and responsibilities as other road users, they are more vulnerable when travelling on the road. Both cyclists and motorists need to consider each other and share the road safely. |
14/07/2021 | View |
|
Cycling Grants Department for Infrastructure and Transport, South Australia South Australian local government councils can apply for the State Bicycle Fund. Applications are invited to be submitted early in the year for the following financial year's program. |
14/07/2021 | View |
 |
Cycle Instead Department for Infrastructure and Transport, South Australia Cycle Instead works as an interactive Journey Planner for your bike trip. It shows you the Bikedirect network across metropolitan Adelaide so you can quickly choose the most direct and comfortable route for your journey using secondary roads, bike lanes, shared paths, greenways and bicycle boulevards. |
13/07/2021 | View |