Resources
This page contains some key resources on walking and cycling, including an archive of the documents produced by the Australian Bicycle Council.
| Date Added | |||
|---|---|---|---|
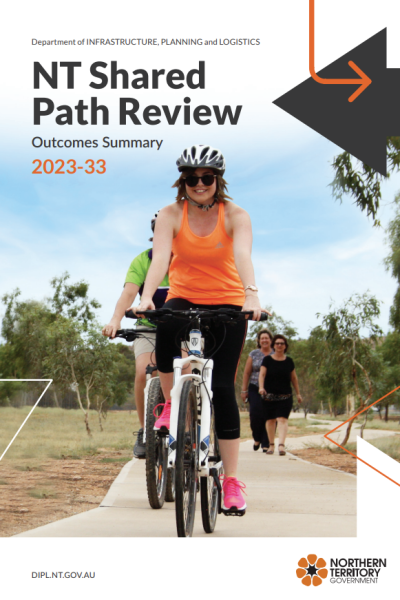 |
Northern Territory shared path network reviews Department of Infrastructure, Planning and Logistics (DIPL), Northern Territory The Department of Infrastructure, Planning and Logistics (DIPL) has completed a review of Northern Territory Government (NTG) owned shared paths across Greater Darwin, Katherine, Tennant Creek and Alice Springs. The review is key to continuing strategic development of shared paths in line with stakeholder and community needs for the next 10 years. The purpose of the review was to assess the existing NTG shared path networks and provide recommendations for:
A number of key considerations guided the review including efficiency, safety and connectivity. |
11/12/2023 | View |
| Getting to and from public transport Waka Kotahi NZ Transport Agency Getting to and from public transport is integral to every public transport journey. All passengers must make their way to a public transport stop to board public transport, then make their way from where they disembark to their final destination. Often referred to as the ‘first and last mile’, the actual length of these trips can range from less than 100m to many kilometres. First and last mile connections are critical to a viable and enjoyable public transport journey experience. Key issues relating to the quality and ease of access to and from a public transport stop include:
It is important that those involved in public transport planning consider the whole of the passengers' journey. When planning for public transport journeys, the following questions should be considered:
|
19/05/2023 | View | |
 |
Research Report 512 The New Zealand accessibility analysis methodology Waka Kotahi NZ Transport Agency This research considers land use and transport accessibility drawing on international practice from the UK, Europe, USA and Australia. An objective of the research was to define accessibility and propose a methodology for how accessibility could be measured and quantified in New Zealand, both at a neighbourhood or a wider area such as a suburb, city or region. The result of the research was an understanding of other countries’ experiences developing and setting accessibility policy and the success of those approaches. This is important because if New Zealand chooses to set explicit accessibility policy, the research explains how that might be best achieved. A second result of the research was the development of a new methodology for calculating accessibility that draws on overseas and improved practice. The new methodology quantitatively measures accessibility taking into consideration different modes of travel (walk, cycle, private motor vehicle etc), travel behaviour (ideally using logistic decay functions), destinations (origin or destination based), activities (consumed or supplied) and multiple opportunities (saturations). The calculation methodology was piloted on Christchurch (a city of some 350,000 people) and the accessibility of every household quantified to a variety of destinations including doctors, supermarkets and schools. Keywords: accessibility, cycling, GIS, indicators, journey planning, methodology, modelling, networks, New Zealand, public transport, transport, walking |
19/05/2023 | View |
 |
Research Report 363 Accessibility planning methods Waka Kotahi NZ Transport Agency This research investigated the applicability of accessibility planning in New Zealand as a tool for assessing and improving personal access to essential services for all New Zealanders. It canvassed international accessibility planning practices in England, the Netherlands and Southern California to understand the various drivers for its introduction and the different approaches taken in its implementation. All three case studies share the goal of improving individuals’ access to activity centres and recognise that accessibility planning is best undertaken at the local level with some form of central government guidance and monitoring. The English comprehensive accessibility planning framework has been adapted to New Zealand’s existing social services and local government legislative and institutional environment and the recently legislated changes to the government land transport sector. The resulting recommended framework employed a collaborative approach to assess and improve people’s accessibility to employment, food shopping, health, education and social services across New Zealand. All levels of government would participate in the assessment of accessibility, development of priorities, indicators and action plans and monitor progress against outcomes, within government frameworks. Transport actions developed by regional accessibility partnerships to address regional problems would feed directly into their regional land transport programmes for prioritisation for funding. |
19/05/2023 | View |
 |
Accessibility Waka Kotahi NZ Transport Agency Key design parameters for accessibility such as kerb arrangements, access ramps, tactile ground surface indicators, and pedestrian movement. |
19/05/2023 | View |
 |
Waka Kotahi Cycling Action Plan Waka Kotahi NZ Transport Agency The Waka Kotahi Cycling Action Plan sets out a pathway to significantly increase the safety and attractiveness of cycling and micromobility in towns and cities across Aotearoa New Zealand. It outlines the strategic priorities for Waka Kotahi, and includes the detailed actions we will take, alongside our partners, to help achieve the substantial shifts required. While it is not a funding plan, it will help inform future transport prioritisation and investment decisions. |
01/05/2023 | View |
 |
Active Travel to School: Bikes in Schools Waka Kotahi New Zealand Transport Agency PROGRAM FEATURES: A typical Bikes in Schools package includes:
Online resources also available, including bike games. DATE IMPLEMENTED: Not available COST: Not available ADDITIONAL INFORMATION: Part of program that also includes BikeReady RESULTS OF EVALUATION: Not available |
17/01/2023 | View |
|
Active Travel to School Program: BikeReady (NZ) Waka Kotahi New Zealand Transport Agency PROGRAM FEATURES:
DATE IMPLEMENTED: Not available COST: Not available ADDITIONAL INFORMATION: Part of program that also includes Bikes in Schools RESULTS OF EVALUATION: Not available |
17/01/2023 | View |
 |
Safer Speeds Case Study - Wellington, New Zealand Wellington City Council STREET NAME: Most central city streets (not main through roads) SUBURB: Wellington COUNTRY: New Zealand SPEED REDUCTION: From 50 km/h to 30 km/h DATE IMPLEMENTED: June 2020.80% of roads within Wellington approved to have speeds recuced to 30 kph Septmber 2022 SCHEME INCLUDED:
COST: $NZ44.8 million (from September 2022) ADDITIONAL INFORMATION:
RESULTS OF EVALUATION: Not available |
20/12/2022 | View |
|
Safer Speeds Case Study - Auckland City Centre Auckland Transport STREET NAME: Multiple SUBURB: Auckland COUNTRY: New Zealand SPEED REDUCTION: Mostly from 50 km/h to 30 km/h DATE IMPLEMENTED: 30 June 2020 SCHEME INCLUDED:
COST: $NZ 49,297,544 (includes reduction of speed limits on all roads including urban and rural) ADDITIONAL INFORMATION:
LESSONS LEARNED:
RESULTS OF EVALUATION: Not available |
20/12/2022 | View |
 |
CWANZ Design Innovations Working Group Practice Note: Contraflow Cycling in Quiet Streets CWANZ The CWANZ Design Innovations Working Group undertook a review of contraflow cycling lanes in quiet streets. This report presents the evidence, technical advice, and implementation and design. Examples of streets with contraflow cycling lanes in Australia and New Zealand are given. |
06/10/2022 | View |
 |
Speed management guide: Road to Zero Edition Waka Kotahi NZTA The Speed management guide: Road to Zero edition supports regional transport committees, regional councils and road controlling authorities |
12/08/2022 | View |
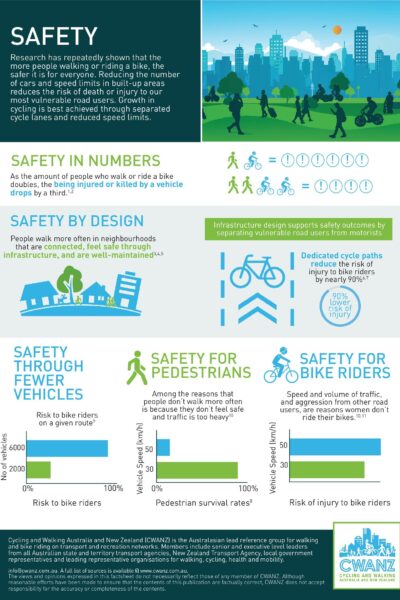 |
CWANZ Fact Sheet: Safety CWANZ Research has repeatedly shown that the more people walking or riding a bike, the safer it is for everyone. Reducing the number of cars and speed limits in built-up areas reduces the risk of death or injury to our most vulnerable road users. Growth in cycling is best achieved through separated cycle lanes and reduced speed limits. |
28/04/2022 | View |
 |
CWANZ Fact Sheet: Benefits of Lower Speed Limits CWANZ Benefits of lower speed limits in high activity areas and local access streets. What happens when vehicles travel more slowly in areas with lots of pedestrians and bike riders? |
19/04/2022 | View |
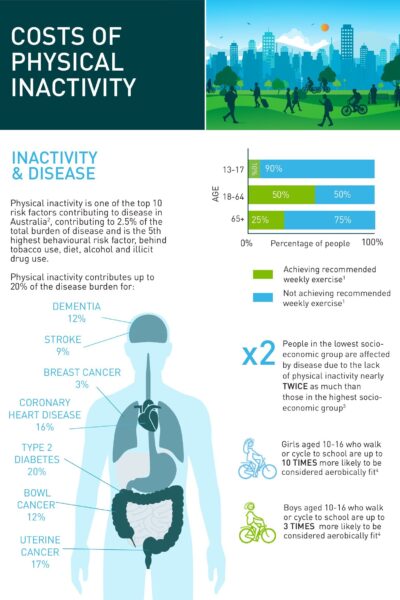 |
CWANZ Fact Sheet: Health Benefits of Active Transport CWANZ Physical inactivity is one of the top 10 risk factors contributing to disease in Australia, contributing to 2.5% of the total burden of disease and is the 5th highest behavioural risk factor, behind tobacco use, diet, alcohol and illicit drug use. |
19/04/2022 | View |
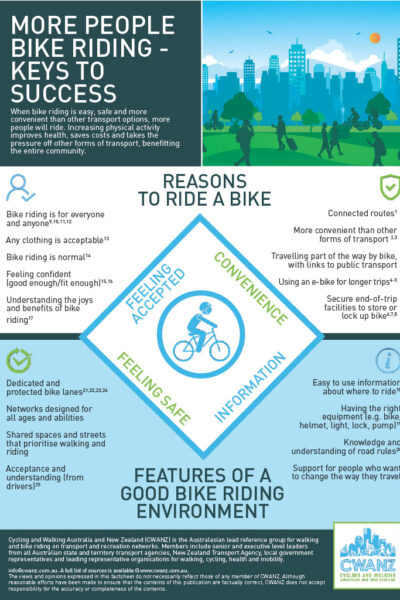 |
CWANZ Fact Sheet: More People Bike Riding - Keys to Success CWANZ When bike riding is easy, safe and more convenient than other transport options, more people will ride. Increasing physical activity improves health, saves costs and takes the |
13/04/2022 | View |
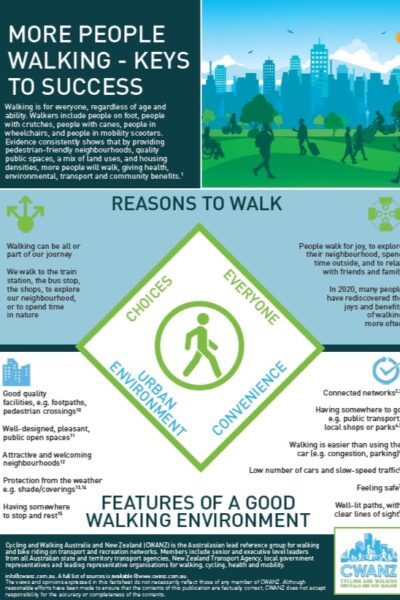 |
CWANZ Factsheet: More People Walking - Keys to Success CWANZ Walking is for everyone, regardless of age and ability. Walkers include people on foot, people with crutches, people with canes, people in wheelchairs, and people in mobility scooters. Evidence consistently shows that by providing pedestrian-friendly neighbourhoods, quality public spaces, a mix of land uses, and housing densities, more people will walk, giving health, environmental, transport and community benefits. |
13/04/2022 | View |
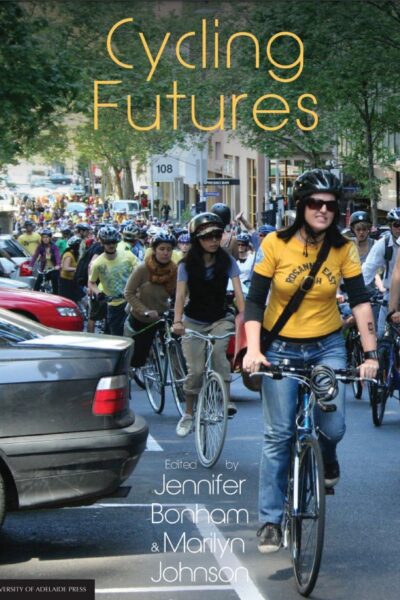 |
Cycling Futures University of Adelaide Press The growing interest in cycling in Australia and New Zealand, as in other parts of the world, is underpinned by three major concerns: health and fitness, congestion and liveability, pollution and climate change. Australasian researchers, practitioners, policy makers and community members are engaged in a global discussion on the role of cycling in addressing these concerns. Contributors to (this) book report on and extend this discussion as they explore the insights generated locally and internationally on the past, present and future of cycling. The focus of the first half of the book is largely on the current engagement with cycling, challenges faced by existing and would-be cyclists and the issues cycling might address. The second half of the book is concerned with strategies and processes of change. Contributors working from different ontological positions reflect on changing socio-spatial relations to enable the broadest possible participation in cycling. |
12/04/2022 | View |
 |
Travel planning toolkit guidelines and resources Waka Kotahi NZ Transport Agency The Waka Kotahi NZ Transport Agency travel planning toolkit provides you with guidelines and resources to make business trips and staff travel to and from work more efficient. You will find links to many resources to help you develop your workplace travel plan. |
07/04/2022 | View |
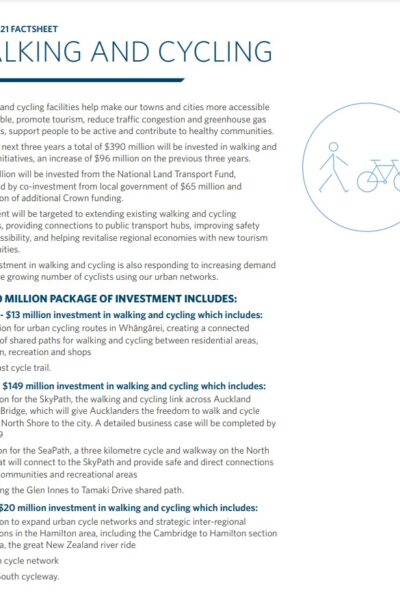 |
Walking and Cycling Improvements Waka Kotahi NZ Transport Agency Walking and cycling facilities help make cities and towns more liveable and support tourism. During 2018–21 about $390 million will be invested in walking and cycling initiatives, which will extend networks across the country and improve connections to a range of transport choices. This will improve safety and accessibility, and make a significant contribution to the revitalisation of town and city centres. Improvments will be made to walking and cycling facilities along state highway corridors up and down the country, as part of our state highway improvement programme. This includes landscaping, new bridges and underpasses to establish safe routes to encourage more people to walk or cycle. |
07/04/2022 | View |
 |
Research report 452 Predicting walkability Waka Kotahi NZ Transport Agency This research provides a number of mathematical formulas for predicting the quality of the walking environment from the perspective of the user using operational and physical variables. The formulas were derived by combining the perception data gathered from participants in the community street reviews with measurements of the walking environment. The two main areas that were researched to enable the derivation of formulas were:
This research describes the process for obtaining the data and deriving the formulas, and recommends the formulas most suitable for practitioner use. |
07/04/2022 | View |
 |
Research report 440 Reducing pedestrian delay at traffic signals Waka Kotahi NZ Transport Agency Since 2000, the benefits of walking as a mode of travel have been recognised by the New Zealand government in a raft of policy statements and strategies. However, the Ministry of Transport acknowledges that there are a number of issues to overcome to encourage more walking. This research focuses on one of the key issues: namely, the delay experienced by pedestrians at traffic signals. Historically, New Zealand's approach to pedestrian delay has been minimal, with pedestrian issues considered primarily from the point of view of safety, rather than level of service or amenity. At traffic signals, pedestrians are often accommodated in a way that causes the least amount of interruption to motorised traffic, and signal cycle times can be long, leading to excessive pedestrian waiting times. This can lead to frustration, causing pedestrians to violate the signals and use their own judgement to cross, resulting in safety risks. This research, which was carried out between 2007 and 2010 in Auckland, Wellington and Christchurch, used techniques such as pedestrian attitude surveys, micro-simulation modelling and a literature review of international best practice to identify methods of reducing pedestrian delay at signalised intersections in these cities. The recommendations developed during the course of the research provide both technical and policy mechanisms for improving pedestrian delay in New Zealand's central-city areas. |
07/04/2022 | View |
 |
Research report 436 Benefits of new and improved pedestrian facilities - before and after studies Waka Kotahi NZ Transport Agency Walking is an essential mode of transport. New and improved pedestrian facilities promote walking and provide greater access and mobility within our communities. The NZ Transport Agency has recently updated the procedures for the evaluation of pedestrian improvement projects. The benefit factor applying to new pedestrian trips was increased from $0.50 to $2.70/km, making pedestrian facility improvement projects more economically viable. Thus, estimating the increase in pedestrian flows (as opposed to simply recording existing pedestrian flows) is now important in the economic evaluation of new or improved facilities. This research analysed case studies at eight New Zealand sites where the implementation of new pedestrian facilities (or the improvement of existing facilities) led to increased pedestrian usage and improved perception of the sites. The study recorded pedestrian rates both before and after facility implementation, and analysed accompanying factors such as safety, delay and directness. It also tried to develop an expected pedestrian-usage model, based on before and after data analysis, for planners and funding agents to use when planning new or improved facilities, and for use in project evaluation. Finally, a monitoring database containing before and after pedestrian count data for various new and improved pedestrian facilities, along with a list of the accompanying factors mentioned above, was developed for future use. |
07/04/2022 | View |
 |
Research Report 435 Walking and cycling: improving combined use of physical activity/health and transport data Waka Kotahi NZ Transport Agency SPARC's Active New Zealand Survey (ANZS) is a high-quality nationwide survey of over 4000 adults collected through face-to-face interviews over 12 months in 2007/08. Although collected mainly to measure levels of sport/recreation activity and to quantify physical activity in general, it includes data of interest to the transport sector on walking and cycling.
|
07/04/2022 | View |
 |
Research Report 431 The mechanisms and types of non-motor vehicle injuries to pedestrians in the transport system and indicated infrastructure implications Waka Kotahi NZ Transport Agency Research carried out in 2008-2010 examined the quantum and causes of non-motor vehicle injuries to pedestrians through a structured interview survey. Pedestrians sustaining injuries in locations away from the road network (eg in parks) were excluded, as the emphasis was on the role of road and footpath features. The highest proportion of trips and falls (34%) was sustained while stepping over a kerb. A further 18% were caused by irregularities in the path or road surface. Factors that amplified the severity of injuries included the road or path surface, pedestrians' inattention, type of footwear worn, and whether walking or running. Two main issues were identified from the study. These were:
The study recommends improving the definition of kerbing in key pedestrian areas and improving the maintenance regime of footpaths and roads used by pedestrians, eg crossings. The study also found that it is necessary to instigate research to provide improved data and analysis tools to prioritise such countermeasures vis-a-vis other uses of road safety funds and improved data for input into such analysis tools. Further, a national guide is needed for pedestrian road safety audits and inspections covering both motor vehicle and non-motor vehicle risk. |
07/04/2022 | View |
 |
Research report 428 Trialling pedestrian countdown timers at traffic signals Waka Kotahi NZ Transport Agency The overall research objective was to evaluate changes in pedestrian safety and traffic efficiency from installing pedestrian countdown timers. The study analysed pedestrian behaviour and safety before and after the installation of a trial countdown timer at the intersection of Queens Street, Bunny Street and Margaret Street in Lower Hutt in July 2007. The results were compared with the 2006/07 trial at the Queen Street/Victoria Street intersection in Auckland CBD and showed very different results. The Auckland city trial indicated that, if placed in suitable locations, pedestrian countdown signals were associated with pedestrian behaviour change that enhanced safety. This study in Lower Hutt demonstrated that the observed pedestrian safety decreased as the percentage of both late starters and late finishers increased, although this was likely to be due to the nature of the intersection with one particularly long diagonal crossing coupled with the allocated phase times. In contrast, perceived pedestrian safety increased with the installation of the countdown timers. |
07/04/2022 | View |
 |
Research Report 359 Valuing the health benefits of active modes Waka Kotahi NZ Transport Agency This report seeks to provide a per-kilometre value for the health benefits of active transport modes (such as walking and cycling) that is compatible with the Land Transport New Zealand Economic Evaluation Manual Volume 2 (EEM2). The first two sections of the report begin by explaining the scope of the project and the background. Section 3 investigates the evidence of the connection between physical activity and health outcomes. Section 4 clarifies the role of active transport modes as physical activity, and reports the New Zealand-specific data about active transport mode engagement. Section 5 gives a brief comparative summary of the literature review of cost-benefit analyses and valuation techniques used overseas to value the health benefits of active modes. This report uses population attributable fractions (PAF) to estimate the annual burden of mortality and morbidity costs per inactive adult. Annual estimates of the costs of inactivity are applied to the New Zealand adult population using a weighted sum to establish a per-kilometre value for each mode. The valuation presented in this report is limited by a poverty of data, but the final values are considered to be a reasonable estimate of the health benefits of active modes. While further research is recommended to obtain more precise estimates of the costs of inactivity in New Zealand, it is considered that the values presented in this report are a sound interim estimate for inclusion in the EEM2. |
07/04/2022 | View |
 |
Research Report 329 Impediments to walking as a mode choice Waka Kotahi NZ Transport Agency Conducted in 2005, this study evaluates a case-control design of contrasts between walkers and drivers to address factors influencing the uptake of walking as a mode choice. With samples drawn from Auckland and Wellington, New Zealand, this research uses a 62-item survey to examine a number of factors: fear of crime; trip-chaining/car dependency; weather; distance/time; social pressure, fatigue and fitness, parking charges, enjoyment of walking, inconvenience, and geography. To avoid factors such as car dependency or the inability to walk, participants are selected because they live a short distance from public transport parking facilities. The group of drivers demonstrate an irregular break in car dependency by driving their cars to the station in order to use public transport. The results indicate that for parking facilities, convenience creates demand. Poor weather has an influence on the decision to drive, and fine weather improves the likelihood of walking. Previous studies claim decisions to walk are impeded by certain factors. While location effects are observed between the groups, these results suggest that such factors are in fact inconsequential. |
07/04/2022 | View |
 |
Research Report 294 Increasing cycling and walking: an analysis of readiness to change Waka Kotahi NZ Transport Agency In 2003, Sport and Recreation New Zealand (SPARC) and the Cancer Society of New Zealand commissioned a major social marketing survey to segment adult New Zealanders in terms of physical activity and healthy eating habits. The questionnaire included several transport-related questions. The resulting ‘Obstacles to Action’ database contains responses from over 8000 people aged 16 or over. |
07/04/2022 | View |
 |
Non-motorised user monitoring technology ViaStrada |
07/04/2022 | View |
 |
Programme/project logic models Waka Kotahi NZ Transport Agency The links provide different guides to developing programme/project logic models. |
07/04/2022 | View |
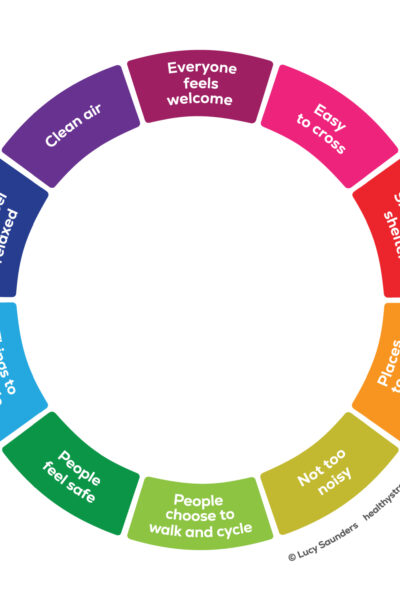 |
Healthy Streets Healthy Streets Towns and cities everywhere are facing the challenge of keeping communities healthy and happy. Healthy Streets® offers clients around the world an evidence-based approach to creating fairer, sustainable and attractive urban spaces. |
07/04/2022 | View |
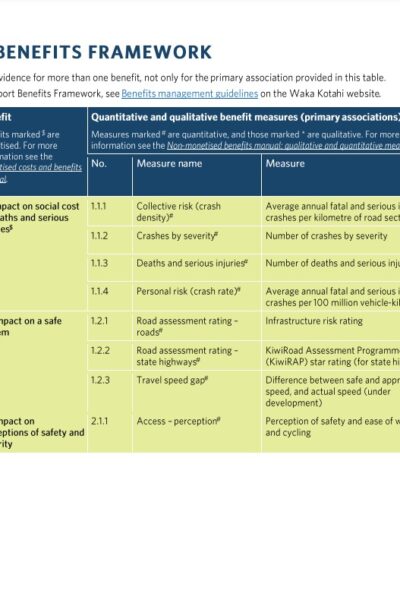 |
Benefits management guidance Waka Kotahi NZ Transport Agency This guidance is to help transport planners, business case writers and anyone involved in transport investment understand the Land Transport Benefits Framework and how to use benefits management in their work. |
07/04/2022 | View |
 |
Code of practice for temporary traffic management (CoPTTM: Part 8 of the Traffic Control Devices manual (TCD Manual) Waka Kotahi NZ Transport Agency This is the standard reference for all temporary traffic management on state highways and local roads. It includes levels of temporary traffic management, signs and forms used, and a series of sample traffic management plans. |
07/04/2022 | View |
 |
Traffic control devices manual (TCD manual) Waka Kotahi NZ Transport Agency The Traffic control devices manual (TCD manual) provides guidance on industry best practice, including, where necessary, practice mandated by law in relation to the use of traffic control devices. |
07/04/2022 | View |
 |
Land Transport (Road User) Rule 2004 Waka Kotahi NZ Transport Agency This rule establishes the rules under which traffic operates on roads. It applies to all road users, whether they are drivers, riders, passengers, pedestrians, or leading or droving animals. |
07/04/2022 | View |
 |
Tactical Urbanism Handbook Waka Kotahi NZ Transport Agency The draft Tactical Urbanism Handbook has been developed as a tool to help councils and communities deliver tactical urbanism projects to a high standard, using a collaborative best-practice approach. |
07/04/2022 | View |
 |
Streets for People Waka Kotahi NZ Transport Agency Creating a healthier future by putting people and place at the heart of our streets. |
07/04/2022 | View |
 |
Standard safety intervention toolkit Waka Kotahi NZ Transport Agency The Standard Safety Intervention toolkit provides guidance for road safety practitioners on the effectiveness and value-for-money cost range of proven safety interventions to reduce the number of people killed and seriously injured on Aotearoa roads. |
07/04/2022 | View |
 |
Safe walking and cycling treatments for intersections and crossings Waka Kotahi NZTransport Agency Waka Kotahi NZTransport Agency and the Transportation Group are hosting a series of free webinars focused on creating vibrant towns and cities. This webinar aims to introduce some of the current state-of-the-art thinking around these safety measures for our active modes. For more information on the ‘Creating vibrant towns and cities’ webinar series, visit www.nzta.govt.nz/creating-vibrant-towns-and-cities |
07/04/2022 | View |
 |
How to Talk About Urban Mobility and Transport Shift: A Short Guide, 2020 The Workshop This guide is designed for technical experts, communicators and advocates working to deliver urban mobility solutions that grow the share of travel by public transport, walking and cycling. Its purpose is to help us use more effective strategies to: improve people’s understanding, based on best evidence, of why a shift in transport modalities away from cars and towards active and public transport is needed; help people designing and leading the shift to have better conversations with the public; motivate people to act in support of these shifts. This guide is based on a literature review conducted by The Workshop on behalf of Waka Kotahi NZ Transport Agency. |
07/04/2022 | View |
 |
How to Talk about Urban Mobility: Narratives for Deeper Understandings Waka Kotahi NZ Transport Agency This webinar provides a theoretically driven, evidence-led framework so we can understand how to: ● improve people’s understanding, based on best evidence, of why a shift in transport modalities away from cars and towards active and public transport is needed ● help people designing and leading the shift to have better conversations with the public ● motivate people to act in support of these shifts. Part of the Creating vibrant towns and cities webinar series https://www.nzta.govt.nz/walking-cycling-and-public-transport/creating-vibrant-towns-and-cities-webinar-series/ |
07/04/2022 | View |
 |
Strategic Parking Management Waka Kotahi NZ Transport Agency Part of Urban Mobility & Liveable Cities Series. Presented by Lorelei Schmitt, Principal Multimodal Advisor, Waka Kotahi NZ Transport Agency and George Lyons |
07/04/2022 | View |
 |
System Change and Communications: Shifting the Dial Waka Kotahi NZ Transport Agency Part of Urban Mobility and Liveable Cities Series, presented by Kathryn King, Portfolio manager Developing Regions, Waka Kotahi NZ Transport Agency |
07/04/2022 | View |
 |
Healthy Streets Waka Kotahi NZ Transport Agency Part of Urban Mobility and Liveable Cities Series. Featuring Claire Pascoe (Waka Kotahi NZ Transport Agency), Hamish Mackie (Mackie Research) and Lemauga Lydia Sosense, Chair Mangere Otahuhu Local Board. |
24/11/2021 | View |
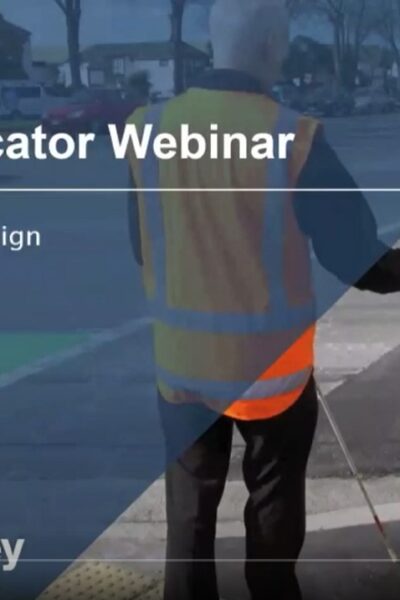 |
Tactile Indicator Installation Note - webinar Waka Kotahi NZ Transport Agency This webinar is for anyone involved in the design, installation and construction supervision of tactile ground surface indicators (TGSIs/tactile paving). |
19/10/2021 | View |
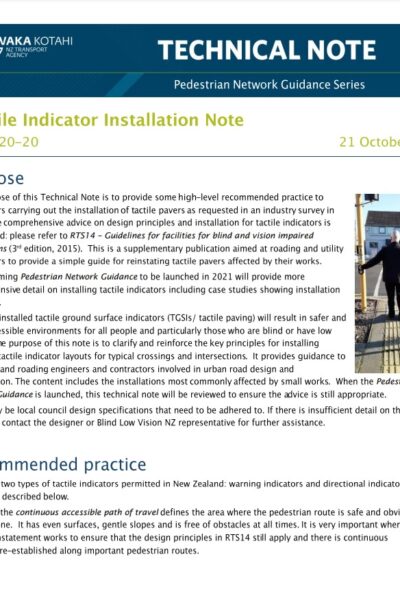 |
Tactile Indicator Installation Note Waka Kotahi NZ Transport Agency The purpose of this technical note is to provide some high-level recommended practice to contractors carrying out the installation of tactile pavers as requested in an industry survey in 2018. This is a supplementary publication aimed at roading and utility contractors to provide a simple guide for reinstating tactile pavers affected by their works. |
19/10/2021 | View |
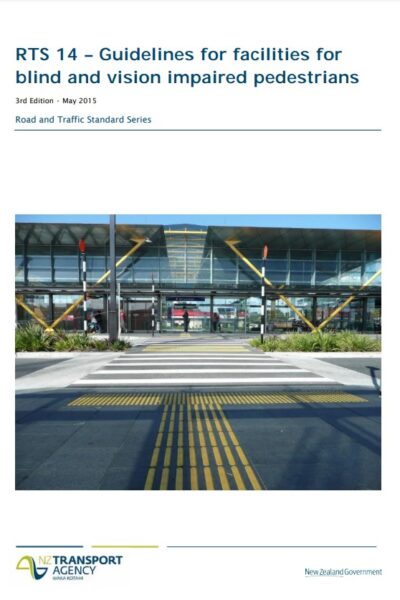 |
RTS14 Guidelines for facilities for blind and vision impaired pedestrians Waka Kotahi NZ Transport Agency RTS 14 is the official guide that ensures that design and operation of roads and paths caters for blind and vision impaired pedestrians. It also takes into account the needs of people with impaired mobility. It provides detailed requirements for a continuous accessible path, tactile ground surface indicators and audible tactile traffic signal features. |
19/10/2021 | View |
 |
Bridging the Gap: NZTA Urban Design Guidelines Waka Kotahi NZ Transport Agency The guidelines seek to improve the understanding of what good urban design means in a transport project. The guidelines are intended for consultants, contractors, project managers, stakeholders and the community who participate in the planning, design, construction and maintenance of our transport networks. They are also intended for other Transport Agency staff whose work and actions affect urban design outcomes. |
19/10/2021 | View |
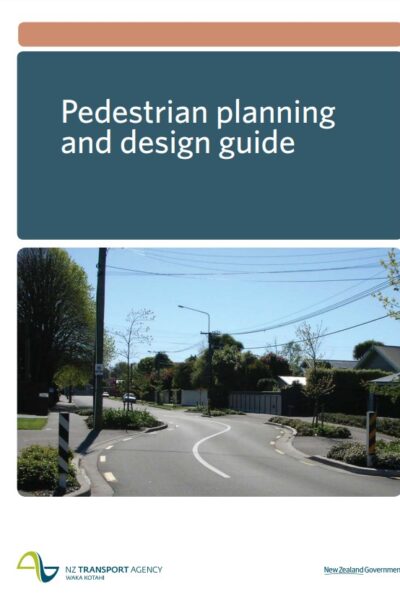 |
Pedestrian Planning and Design Guide Waka Kotahi NZ Transport Agency The Pedestrian planning and design guide is New Zealand's comprehensive official guide to planning and design for walking. It sets out ways to improve New Zealand’s walking environment |
19/10/2021 | View |
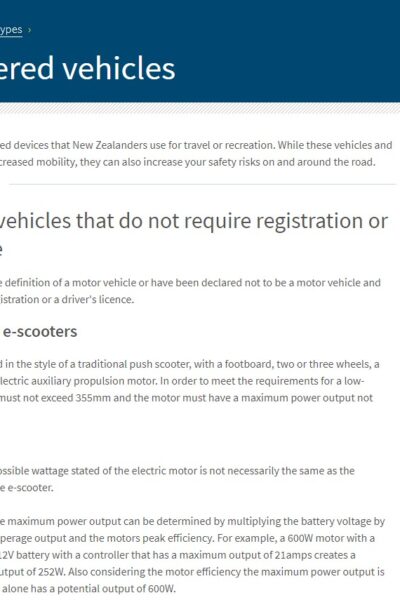 |
Low-powered Vehicles Waka Kotahi NZ Transport Agency There is a range of low-powered devices that New Zealanders use for travel or recreation. While these vehicles and devices offer the benefit of increased mobility, they can also increase your safety risks on and around the road. |
19/10/2021 | View |
 |
NZ Road Code Information for Pedestrians Waka Kotahi NZ Transport Agency As a pedestrian, it’s important that you follow the road rules and guidelines. They will help ensure your safety when you’re walking near roads or crossing the road. |
19/10/2021 | View |
 |
NZ Road Code for Cyclists Waka Kotahi NZ Transport Agency |
19/10/2021 | View |
 |
Trials Underway and Rules Changes Waka Kotahi NZ Transport Agency Keeps the industry up to date with cycle design trials that are currently underway, or have been completed in recent years, and also what cycling-related rules are being reviewed and when |
19/10/2021 | View |
|
Designing a Cycling Facility Waka Kotahi NZ Transport Agency Provides users with best practice guidance, either directly or through links to appropriate sources for all stages of design, from concept stage through to detailed design |
19/10/2021 | View |
 |
Planning a Cycling Network Waka Kotahi NZ Transport Agency Provides users with best practice guidance, either directly or through links to appropriate sources for all stages of planning a cycle network |
19/10/2021 | View |
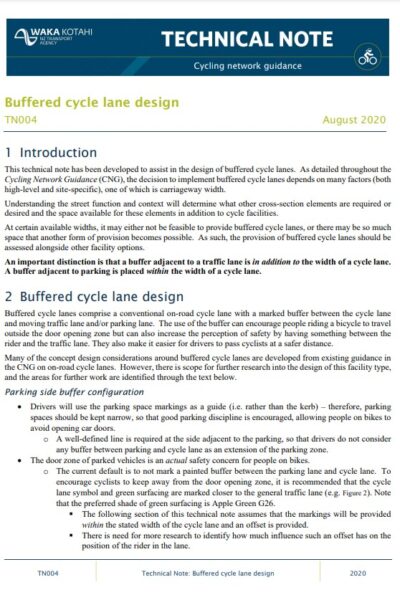 |
Technical note #4: Buffered Cycle Lane Design Waka Kotahi NZ Transport Agency Guidance on the design of buffered cycle lanes for varying carriageway widths |
19/10/2021 | View |
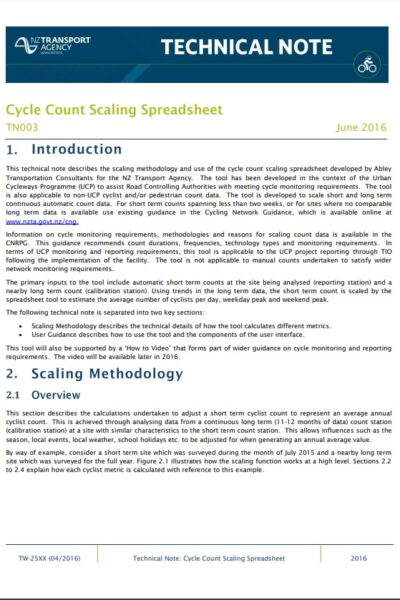 |
Technical note #3: Cycle Count Scaling Spreadsheet Waka Kotahi NZ Transport Agency Describes scaling methodology and use of the Cycle count scaling spreadsheet tool, used to scale permanent and short-term count data for average daily cyclist values |
19/10/2021 | View |
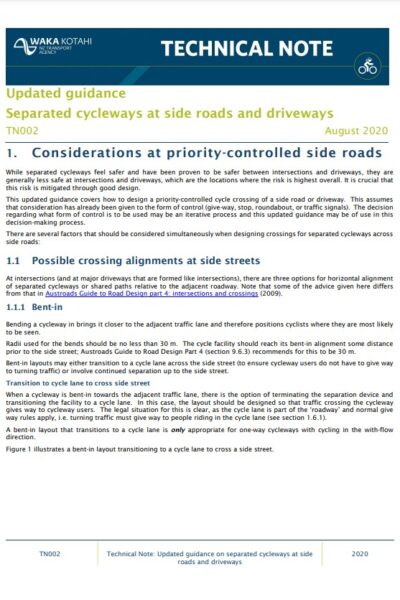 |
Technical note #2: Separated Cycleways at Side Roads and Driveways Waka Kotahi NZ Transport Agency This updated guidance covers how to design a priority-controlled cycle crossing of a side road or driveway |
19/10/2021 | View |
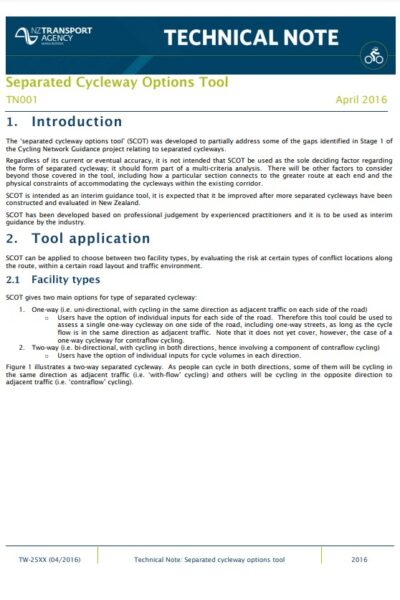 |
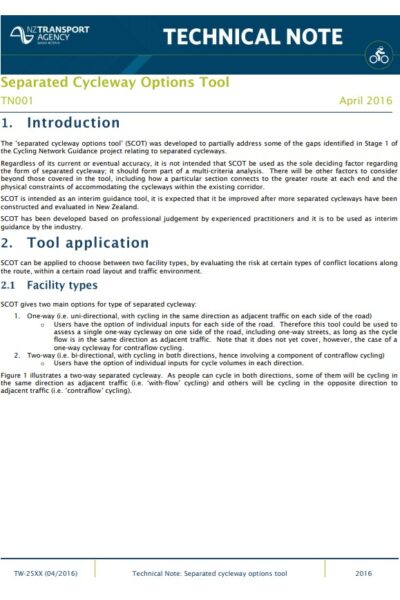
Technical note #1: Separated Cycleway Options Tool Waka Kotahi NZ Transport Agency Guidance on use of the Separated cycleway options tool (SCOT), used to assist in the decision on whether to provide two 1-way facilities or a single 2-way facility on a particular route |
19/10/2021 | View |
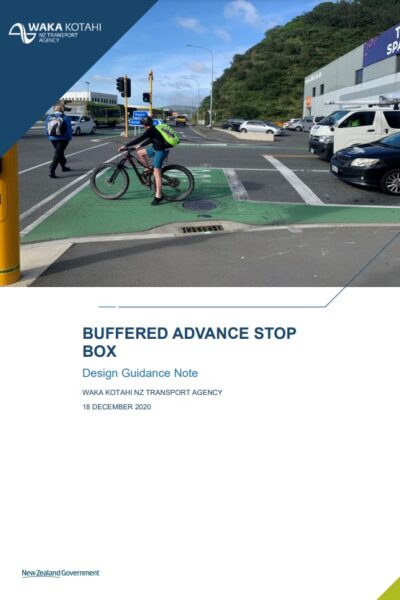 |
Buffered Advance Stop Box Waka Kotahi NZ Transport Agency Provides a treatment solution for advance stop boxes to improve visibility of cyclists from heavy vehicles and decrease the level of vehicle encroachment |
19/10/2021 | View |
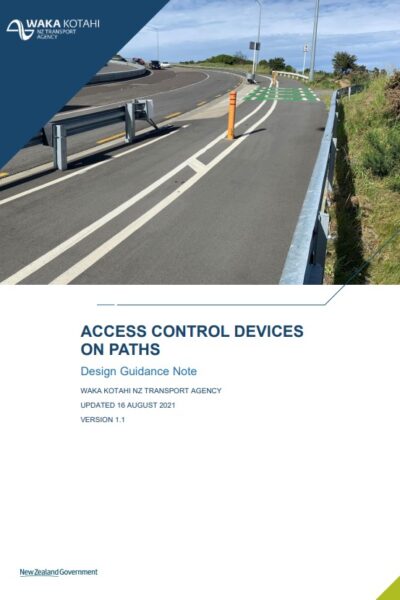 |
Access Control Devices Waka Kotahi NZ Transport Agency Guidance on the design, installation and management of access control devices on facilities where cyclists are permitted to be present. |
18/10/2021 | View |
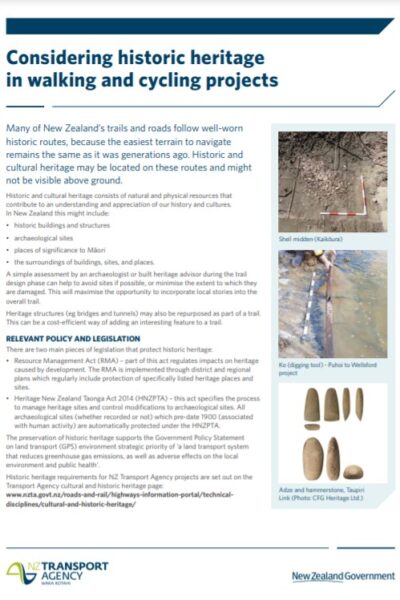 |
Considering Historic Heritage in Walking and Cycling Projects Waka Kotahi NZ Transport Agency The draft Handbook for tactical urbanism has been developed as a tool to help councils and communities deliver tactical urbanism projects to a high standard, using a collaborative best-practice approach. |
07/10/2021 | View |
 |
Draft Handbook for Tactical Urbanism in Aotearoa Waka Kotahi NZ Transport Agency The draft Handbook for tactical urbanism has been developed as a tool to help councils and communities deliver tactical urbanism projects to a high standard, using a collaborative best-practice approach. |
06/10/2021 | View |
 |
Draft Handbook for tactical urbanism in Aotearoa - Guidance: roadway art Waka Kotahi NZ Transport Agency A supplement to the Handbook for tactical urbanism provides draft guidance on compliant application of using road artwork effectively and safely in New Zealand. |
30/09/2021 | View |
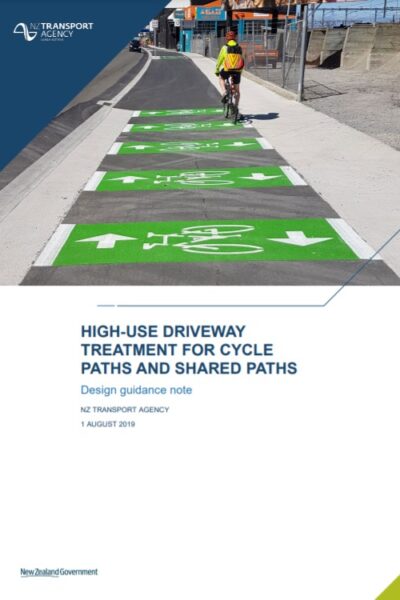 |
High-use driveway treatment for cycle paths and shared paths Waka Kotahi NZ Transport Agency Provides a treatment solution for commercial and high-use access points on cycleways and shared paths. |
30/09/2021 | View |
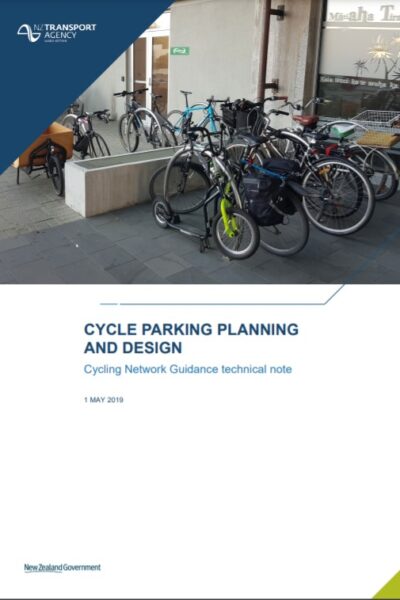 |
Cycle Parking Planning and Design Waka Kotahi NZ Transport Agency This guidance summarises best practice provision of parking and end-of-trip facilities for people who cycle. |
30/09/2021 | View |
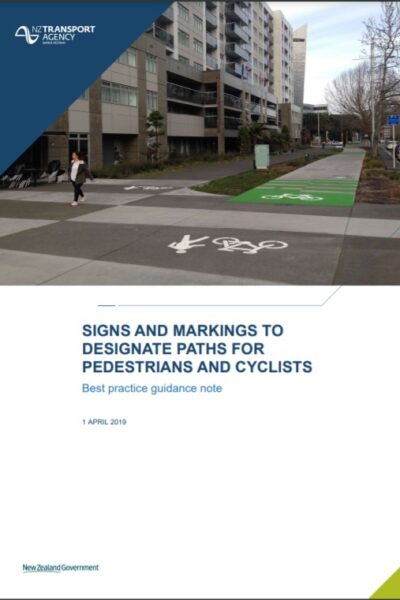 |
Signs and markings to designate paths for pedestrians and cyclists Waka Kotahi NZ Transport Agency Guidance on where and how to use markings and/or signs that designate paths for pedestrians and/or cyclists. |
30/09/2021 | View |
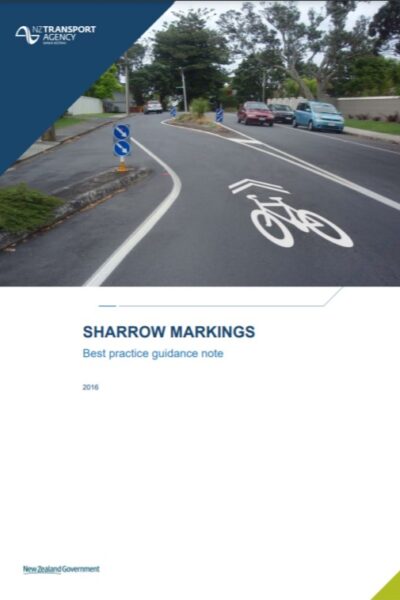 |
Sharrow Markings Waka Kotahi NZ Transport Agency Guidance on the implementation of shared lane markings (‘sharrows’). |
30/09/2021 | View |
 |
Cycle Facility Cost Estimation Tool Waka Kotahi NZ Transport Agency Tool to calculate and compare the rough order cost of a range of cycle route, facility and signalised intersection options. |
24/09/2021 | View |
 |
Cycleway Separation Device Selection Matrix Waka Kotahi NZ Transport Agency Matrix comparing types of cycleway separation device, and issues to be considered. |
24/09/2021 | View |
 |
Cycle Count Scaling Spreadsheet Tool Waka Kotahi NZ Transport Agency Allows permanent and short-term count data to be scaled to average daily cyclist values. |
24/09/2021 | View |
 |
Separated Cycleway Options Tool Waka Kotahi NZ Transport Agency Tool to assist in the decision on whether to provide two 1-way facilities or a single 2-way facility on a particular route. |
21/09/2021 | View |
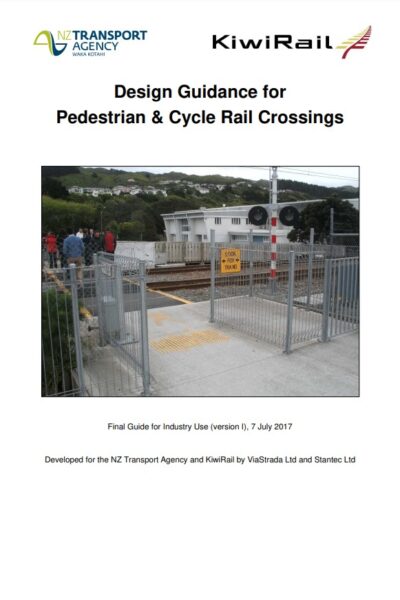 |
Design Guidance for Pedestrian and Cycle Rail Crossings Waka Kotahi NZ Transport Agency Waka Kotahi NZ Transport Agency and KiwiRail have been leading the development of a design guide for pedestrian and cycleway treatment at level crossings. The guide will improve safety, usability, compliance, consistency and will simplify the design process. |
21/09/2021 | View |
 |
Cycling Network Guidance Waka Kotahi NZ Transport Agency Cycling network guidance – planning and design (CNG) framework aims to promote a consistent, best-practice approach to cycling network and route planning throughout New Zealand. |
06/09/2021 | View |
 |
Research Report 660: Factors affecting cycling levels of service Waka Kotahi NZ Transport Agency This report examines cyclists’ perceptions of cycle infrastructure levels of service and proposes an assessment methodology for evaluating the level of service provided by cycling facilities. |
03/09/2021 | View |
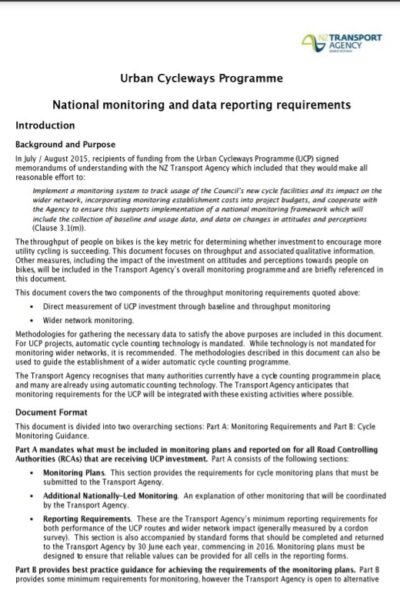 |
Urban Cycleways Programme: National monitoring and data reporting requirements Waka Kotahi NZ Transport Agency Outlines the national monitoring and reporting requirements for the Urban Cycleways Programme (UCP) projects. Includes best practice methodologies for measuring the success of new cycle infrastructure as well as wider network monitoring. |
18/08/2021 | View |
 |
Monitoring and Reporting Waka Kotahi NZ Transport Agency A description of the monitoring required, particularly once the implementation of the cycle network plan has started. |
18/08/2021 | View |
 |
Cycling Photo Library Waka Kotahi NZ Transport Agency Browse our collection of vibrant photos showcasing kiwi landmarks and everyday New Zealanders cycling in a variety of settings. |
18/08/2021 | View |
 |
Workplace Cycling Guide Waka Kotahi NZ Transport Agency This online guide provides all the key information to help your workplace better provide for people on bikes. |
18/08/2021 | View |
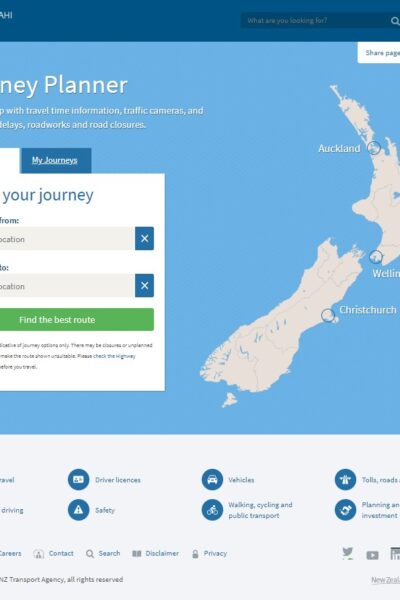 |
Journey Planner Waka Kotahi NZ Transport Agency |
13/08/2021 | View |
 |
Employer e-bike Purchase Support Schemes Waka Kotahi NZ Transport Agency Employer e-bike purchase support schemes are helping many more people to purchase e-bikes by addressing the key barrier of the upfront cost. They work through employers negotiating a discount from an e-bike supplier and then providing a wage advance or loan to staff, paid back through salary deductions over a set period. |
13/08/2021 | View |
 |
Research Report 621: Regulations and Safety for Electric Bicycles and Other Low-powered Vehicles Waka Kotahi NZ Transport Agency This research report presents a review of overseas legislation, technology trends, market and safety analyses for low-powered, low-speed vehicles. |
13/08/2021 | View |
 |
Cycling Skills and Training Waka Kotahi NZ Transport Agency A national cycling education system called BikeReady to increase the reach of cycling education in New Zealand. The system will improve quality and consistencies based on best practice, and, provide a monitoring and evaluation framework so we can assess how effective the system is at improving safety and encouraging more people to ride. |
12/08/2021 | View |
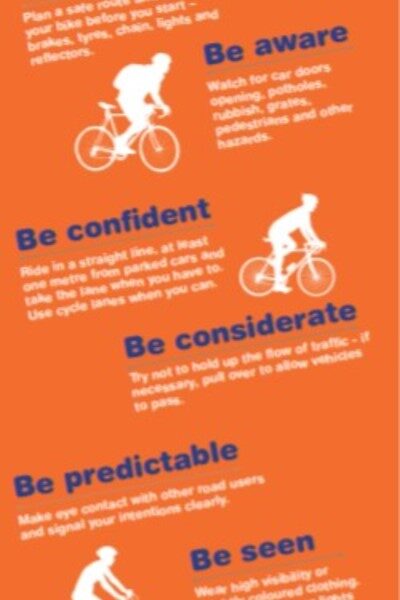 |
Cycle Safety Waka Kotahi NZ Transport Agency A few simple tips to stay safe when sharing the road. |
12/08/2021 | View |
 |
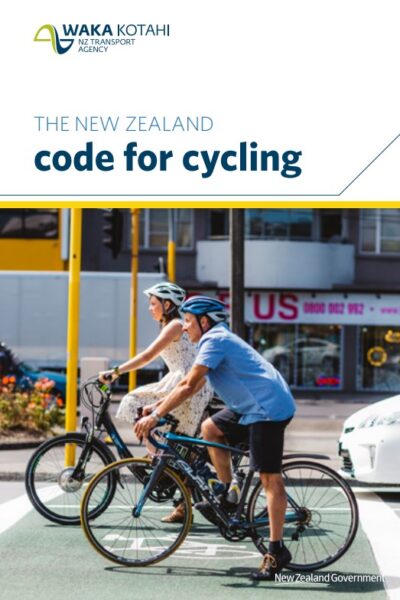
New Zealand Road Code for Cyclists Waka Kotahi NZ Transport Agency The official New Zealand code for cyclists is a user-friendly guide to New Zealand’s traffic law and safe cycling practices. |
12/08/2021 | View |
 |
Keeping Cities Moving Waka Kotahi NZ Transport Agency Waka Kotahi NZ Transport Agency has developed a plan to deliver on social, environmental and economic outcomes by growing the share of travel by public transport, walking and cycling (also known as mode shift). |
04/08/2021 | View |