Resources
This page contains some key resources on walking and cycling, including an archive of the documents produced by the Australian Bicycle Council.
| Date Added | |||
|---|---|---|---|
 |
Australian Transport Assessment and Planning (ATAP) Mode Specific Guidance: M4 Active Travel Australian Transport Assessment and Planning (ATAP) At a glance:
|
13/11/2023 | View |
| Disability Standards for Accessible Public Transport 2002 (Transport Standards) Department of Infrastructure, Transport, Regional Development, Communications and the Arts The Disability Discrimination Act 1992(the Act) is in place to eliminate discrimination against people with disability as far as possible, and to promote community acceptance of the principle that people with disability have the same fundamental rights as all members of the community. The Act provides that direct and indirect discrimination on the basis of disability is unlawful in a broad range of areas of public life, including and access to goods, services and facilities. The Disability Standards for Accessible Public Transport 2002 (Transport Standards) provide requirements for public transport operators and providers to make their services accessible and remove discrimination against people with disability. The Transport Standards took effect on 23 October 2002. The Transport Standards apply to train, tram, bus and coach, ferry, taxi and aviation services and are designed to provide certainty to providers and operators of public transport services and infrastructure about their responsibilities under the Disability Discrimination Act 1992. |
13/10/2023 | View | |
 |
National Walking and Cycling Participation Survey 2023 CWANZ The National Walking and Cycling Participation Survey (NWCPS) provides insight into walking and cycling activity across Australia and is a successor to the National Cycling Participation Survey which was conducted biennially from 2011 to 2019. |
22/09/2023 | View |
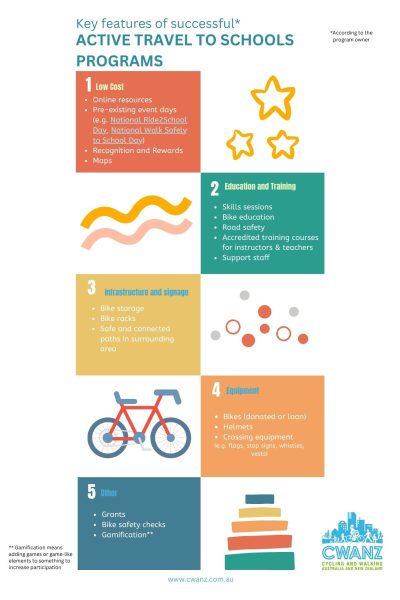 |
Active Travel to Schools Programs CWANZ An overview of active travel to schools programs across Australia and New Zealand, their key features and what makes them successful. Also includes a comparison of the number of children that use active travel to school from around the world. |
23/08/2023 | View |
 |
Active Travel to School Program: National Walk Safely to School Day Pedestrian Council of Australia PROGRAM FEATURES:
DATE IMPLEMENTED: Not available COST: Not available. Free for schools. RESULTS OF EVALUATION: Not available |
30/01/2023 | View |
|
Active Travel to School Program: Bikes for Schools AusCycling PROGRAM FEATURES:
DATE IMPLEMENTED: Not available COST: Not available ADDITIONAL INFORMATION: Ride Nation funds:
Plus they:
RESULTS OF EVALUATION: Not available |
16/01/2023 | View |
|
Active Travel to School Program: Ride Nation Schools AusCycling PROGRAM FEATURES: Ride Nation Schools is a learn-to-ride Bike Education Program delivered in schools Australia-wide. It is a fun and interactive learning experience that teaches young people to develop their riding skills and confidence – supporting kids in their independence and giving parents peace of mind. DATE IMPLEMENTED: Not available COST: Not available ADDITIONAL INFORMATION: There are three levels of bike education programs in schools: Ride Nation - Skills (Playground): Recommended for grades 2-3, this 4–6-week program focuses on developing the essential bike control skills braking, balancing and riding. The skills learnt in this program will allow them to ride around in traffic free environments (school yard, park and around the block). Ride Nation - Confidence (Pathways): Recommended for grades 3-5. Once grasping the essential bike control skills, participants are ready to develop their riding confidence. This 4-6-week program focuses on riding and situational awareness, providing students with the skills and competences to enable them to start riding on footpaths and shared pathway in low traffic environments. This program is ideal to start having students riding to and from school! Ride Nation - Explore (Places): Recommended for grades 5-6. Looks at utilising all the skills learnt through previous programs and develop them in different cycling situations and explore their local area by developing road safety and situational awareness. The program consists of four weeks of practical skill development and learning and ends with two local community rides for children to understand what is in their community. RESULTS OF EVALUATION: Not available |
16/01/2023 | View |
|
Active Travel to School Program: Ride2School Bicycle Network PROGRAM FEATURES:
DATE IMPLEMENTED: Not available COST: Not available ADDITIONAL INFORMATION: Suite of programs to help break down the barriers that prevent more students from staying active on their journey to school. Culminates in National Ride2School Day. RESULTS OF EVALUATION: Not available |
09/01/2023 | View |
 |
Safer Speeds Case Study - Fitzroy & Collingwood, Victoria STREET NAME: Treatment area located between Alexandra Parade (north), Hoddle Street (east), Johnston Street (south) and Nicholson Street (west) SUBURB: Fitzroy and Collingwood MUNICIPALITY: City of Yarra, Melbourne STATE & COUNTRY: Victoria, Australia SPEED REDUCTION: From 40 km/h to 30 km/h DATE IMPLEMENTED: January 2020 (trial start October 2018) SCHEME INCLUDED:
COST: Not available ADDITIONAL INFORMATION:
Observations of pedestrian and cyclist activity were undertaken at a limited number of locations within the treatment and non-treatment areas during three days before the trial implementation and three days at 12 months into the trial. The small number of locations and survey days limits the ability for general conclusions. The data shows a 12.7% drop in pedestrian activity (largely driven by a single site) and a 27.8% increase in cycling activity. LESSONS LEARNED: For some members of the community there was confusion about how the pedestrian priority at the crossings worked, how to determine when to enter and how to exit the roundabout. There are feelings of frustration caused by inconvenience to the driving experience which are perceived to be caused by the Wombat Crossings. Intercept surveys at the Wombat Crossings found people using them thought they created a more convenient walking experience however there was still concern about understanding how the crossings worked and the expectations of people walking and people driving. Information about the benefits of the crossings and the expectations of all road users would assist the community to understand the role they play in creating a pedestrian priority city centre. |
06/10/2022 | |
 |
CWANZ Design Innovations Working Group Practice Note: Contraflow Cycling in Quiet Streets CWANZ The CWANZ Design Innovations Working Group undertook a review of contraflow cycling lanes in quiet streets. This report presents the evidence, technical advice, and implementation and design. Examples of streets with contraflow cycling lanes in Australia and New Zealand are given. |
06/10/2022 | View |
|
Safer Speeds Case Studies - Gold Coast, Queensland City of Gold Coast LOCATION: Cavill Avenue/Orchid Avenue, Surfers Paradise SPEED REDUCTION: Various – some 50 km/h to 40km/h, 50km/h to 30km/h and 40km/h to 30km/h MUNICIPALITY: City of Gold Coast STATE & COUNTRY: Queensland, Australia SCHEME INCLUDED:
DATE IMPLEMENTED: Various COST: Noted as low-cost initiative in the Gold Coast Road Safety Plan 2021-2026 ADDITIONAL INFO: General support and now going back to some 50km/h to 40km/h zones and undertaking further reviews to reduce to 30km/h LESSONS LEARNED:
|
19/07/2022 | View |
 |
CWANZ Design Innovations Working Group: Use of Banana Deflection Rails CWANZ The CWANZ Design Innovations Working Group undertook a review of the use of banana deflection rails (banana bars) in Australia. In undertaking this review, they considered the Traffic and Road Use Management Volume1–Guide to Traffic Management Part 6: Intersections, Interchanges and Crossings (2020) prepared by the Queensland Department of Transport and Main Roads (TMR), and Municipal Infrastructure Standards (MIS) 05 – Active Travel Facilities Design, prepared by Transport Canberra City Services (TCCS). |
12/07/2022 | View |
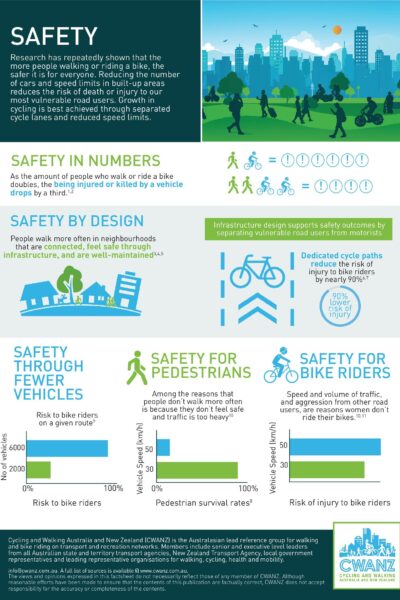 |
CWANZ Fact Sheet: Safety CWANZ Research has repeatedly shown that the more people walking or riding a bike, the safer it is for everyone. Reducing the number of cars and speed limits in built-up areas reduces the risk of death or injury to our most vulnerable road users. Growth in cycling is best achieved through separated cycle lanes and reduced speed limits. |
28/04/2022 | View |
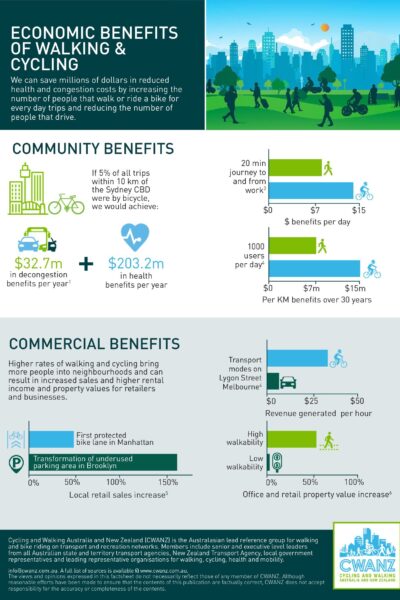 |
CWANZ Fact Sheet: Economic Benefits of Walking & Cycling CWANZ We can save millions of dollars in reduced health and congestion costs by increasing the number of people that walk or ride a bike for every day trips and reducing the number of people that drive. |
19/04/2022 | View |
 |
CWANZ Fact Sheet: Benefits of Lower Speed Limits CWANZ Benefits of lower speed limits in high activity areas and local access streets. What happens when vehicles travel more slowly in areas with lots of pedestrians and bike riders? |
19/04/2022 | View |
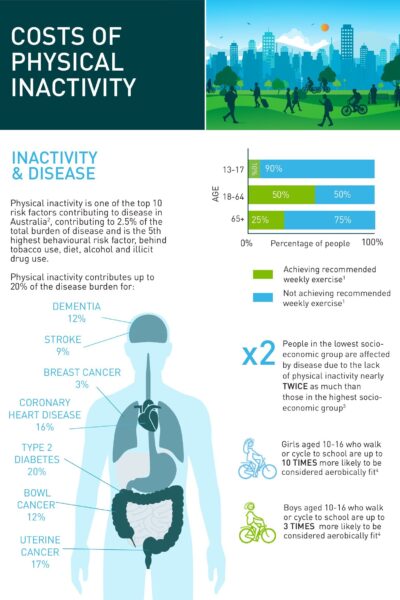 |
CWANZ Fact Sheet: Health Benefits of Active Transport CWANZ Physical inactivity is one of the top 10 risk factors contributing to disease in Australia, contributing to 2.5% of the total burden of disease and is the 5th highest behavioural risk factor, behind tobacco use, diet, alcohol and illicit drug use. |
19/04/2022 | View |
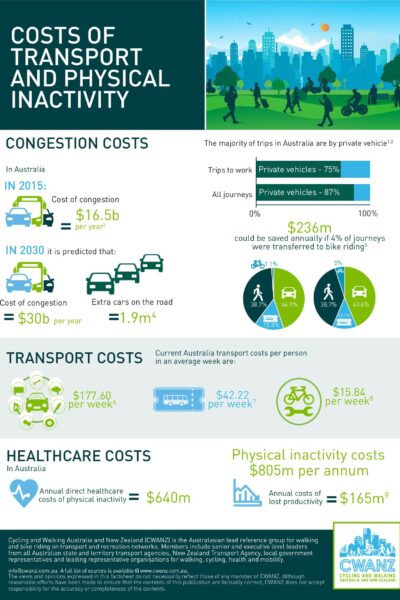 |
CWANZ Fact Sheet: Costs of Transport and Physical Inactivity CWANZ Congestion costs, transport costs and healthcare costs of physical inactivity. |
13/04/2022 | View |
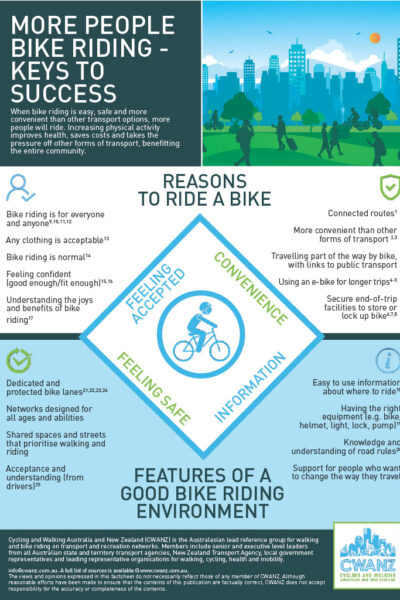 |
CWANZ Fact Sheet: More People Bike Riding - Keys to Success CWANZ When bike riding is easy, safe and more convenient than other transport options, more people will ride. Increasing physical activity improves health, saves costs and takes the |
13/04/2022 | View |
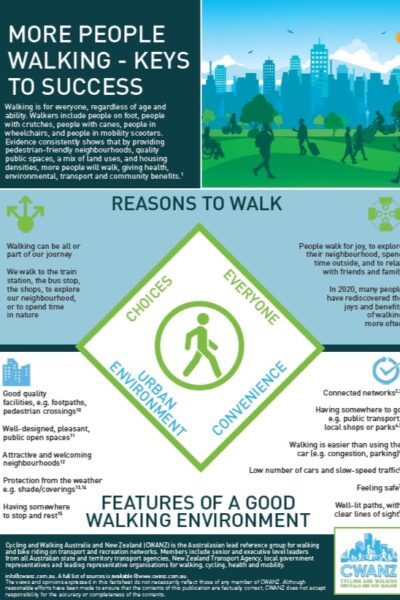 |
CWANZ Factsheet: More People Walking - Keys to Success CWANZ Walking is for everyone, regardless of age and ability. Walkers include people on foot, people with crutches, people with canes, people in wheelchairs, and people in mobility scooters. Evidence consistently shows that by providing pedestrian-friendly neighbourhoods, quality public spaces, a mix of land uses, and housing densities, more people will walk, giving health, environmental, transport and community benefits. |
13/04/2022 | View |
 |
Bicycle helmet use, an excerpt from – Cyclist safety: an investigation of how cyclists and drivers interact on the roads Amy Gillett Foundation The use of bicycle helmets by cyclists is widely supported amongst the injury prevention and health promotion communities. |
12/04/2022 | View |
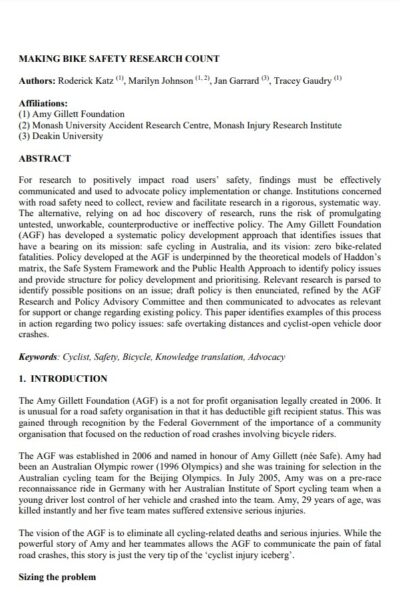 |
Making bike safety research count Amy Gillett Foundation Given the lack of participation data and the underreporting of cyclist injury crashes, it is difficult to determine the magnitude of cyclist road trauma with any precision. This lack of data highlights the neglect in Australia of cyclist-focused monitoring that is essential to understanding injury rates and factors that contribute to cyclist crashes. The Amy Gillett Foundation (AGF) has developed a systematic policy development approach that identifies two issues: safe overtaking distances and cyclist-open vehicle door crashes, explored in this paper. |
12/04/2022 | View |
 |
Why do cyclists infringe at red lights? An investigation of Australian cyclists’ reasons for red light infringement Accident Analysis & Prevention This study investigated the behavioural, attitudinal and traffic factors contributing to red light infringement by Australian cyclists using a national online survey. The survey was conducted from February to May 2010. In total, 2061 cyclists completed the survey and 37.3% reported that they had ridden through a signalised intersection during the red light phase. The main predictive characteristics for infringement were: gender with males more likely to offend than females (OR: 1.54, CI: 1.22–1.94); age with older cyclists less likely to infringe compared to younger cyclists 18–29 years (30–49 yrs: OR: 0.71, CI: 0.52–0.96; 50+ yrs: OR: 0.51, CI: 0.35–0.74), and; crash involvement with cyclists more likely to infringe at red lights if they had not previously been involved in a bicycle–vehicle crash while riding (OR: 1.35; CI: 1.10–1.65). The main reasons given for red light infringement were: to turn left (32.0%); because the inductive loop detector did not detect their bike (24.2%); when there was no other road users present (16.6%); at a pedestrian crossing (10.7%); and ‘Other’ (16.5%). A multinomial logistic regression model was constructed to examine the associations between cyclist characteristics and reasons for infringement. Findings suggest that some cyclists are motivated to infringe by their perception that their behaviour is safe and that infrastructure factors were associated with infringement. Ways to manage this, potentially risky, behaviour including behaviour programmes, more cyclist-inclusive infrastructure and enforcement are discussed. |
12/04/2022 | View |
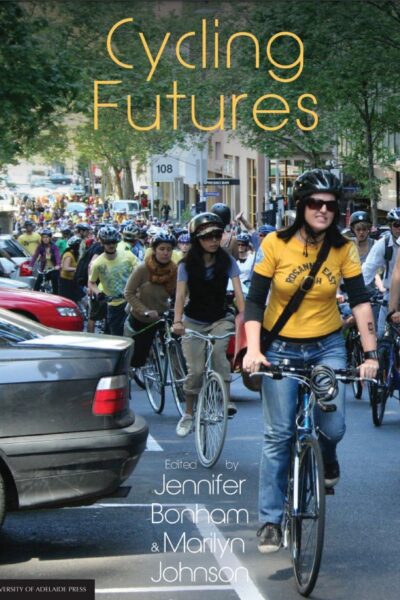 |
Cycling Futures University of Adelaide Press The growing interest in cycling in Australia and New Zealand, as in other parts of the world, is underpinned by three major concerns: health and fitness, congestion and liveability, pollution and climate change. Australasian researchers, practitioners, policy makers and community members are engaged in a global discussion on the role of cycling in addressing these concerns. Contributors to (this) book report on and extend this discussion as they explore the insights generated locally and internationally on the past, present and future of cycling. The focus of the first half of the book is largely on the current engagement with cycling, challenges faced by existing and would-be cyclists and the issues cycling might address. The second half of the book is concerned with strategies and processes of change. Contributors working from different ontological positions reflect on changing socio-spatial relations to enable the broadest possible participation in cycling. |
12/04/2022 | View |
 |
Cycle Safe Communities Amy Gillett Foundation Cycle Safe Communities provides community groups, councils and organisations access to cycle safety campaign resources. Developed by the Amy Gillett Foundation, Cycle Safe Communities enables consistent messaging about bike rider safety to be adopted and embedded in the Australian community. Everyone has the right to ride safely for work and play. A safer future is possible! |
12/04/2022 | View |
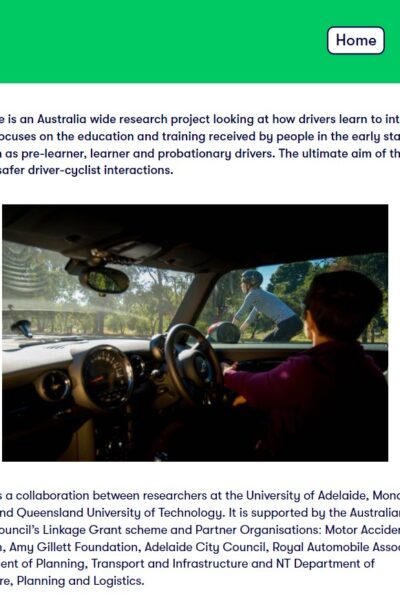 |
Cycle Aware University of Adelaide, Monash University and Queensland University of Technology Cycle Aware is an Australia wide research project looking at how drivers learn to interact with cyclists. It focuses on the education and training received by people in the early stages of driving such as pre-learner, learner and probationary drivers. The ultimate aim of the project is to foster safer driver-cyclist interactions. |
07/04/2022 | View |
 |
Sharing Roads Safely: Vulnerable Road User Training Amy Gillett Foundation Sharing Roads Safely is a training course developed suitable for heavy vehicle drivers to increase safe interactions with vulnerable road users, specifically motorbike riders, cyclists and pedestrians. Based on international best practice, the course was developed in consultation with the government, the heavy vehicle industry and vulnerable road user groups for drivers in Australia. Sharing Roads Safely is a recognised training course and meets compliance requirements for vulnerable road user awareness training.
|
07/04/2022 | View |
 |
Research report 452 Predicting walkability Waka Kotahi NZ Transport Agency This research provides a number of mathematical formulas for predicting the quality of the walking environment from the perspective of the user using operational and physical variables. The formulas were derived by combining the perception data gathered from participants in the community street reviews with measurements of the walking environment. The two main areas that were researched to enable the derivation of formulas were:
This research describes the process for obtaining the data and deriving the formulas, and recommends the formulas most suitable for practitioner use. |
07/04/2022 | View |
 |
Research Report 359 Valuing the health benefits of active modes Waka Kotahi NZ Transport Agency This report seeks to provide a per-kilometre value for the health benefits of active transport modes (such as walking and cycling) that is compatible with the Land Transport New Zealand Economic Evaluation Manual Volume 2 (EEM2). The first two sections of the report begin by explaining the scope of the project and the background. Section 3 investigates the evidence of the connection between physical activity and health outcomes. Section 4 clarifies the role of active transport modes as physical activity, and reports the New Zealand-specific data about active transport mode engagement. Section 5 gives a brief comparative summary of the literature review of cost-benefit analyses and valuation techniques used overseas to value the health benefits of active modes. This report uses population attributable fractions (PAF) to estimate the annual burden of mortality and morbidity costs per inactive adult. Annual estimates of the costs of inactivity are applied to the New Zealand adult population using a weighted sum to establish a per-kilometre value for each mode. The valuation presented in this report is limited by a poverty of data, but the final values are considered to be a reasonable estimate of the health benefits of active modes. While further research is recommended to obtain more precise estimates of the costs of inactivity in New Zealand, it is considered that the values presented in this report are a sound interim estimate for inclusion in the EEM2. |
07/04/2022 | View |
 |
Programme/project logic models Waka Kotahi NZ Transport Agency The links provide different guides to developing programme/project logic models. |
07/04/2022 | View |
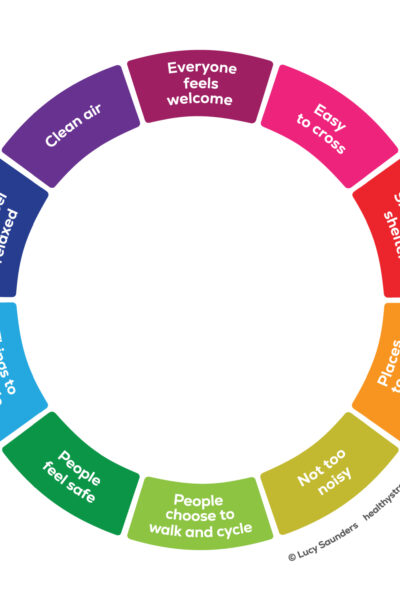 |
Healthy Streets Healthy Streets Towns and cities everywhere are facing the challenge of keeping communities healthy and happy. Healthy Streets® offers clients around the world an evidence-based approach to creating fairer, sustainable and attractive urban spaces. |
07/04/2022 | View |
 |
National Walking and Cycling Participation Survey 2021 - Final Report Cycling & Walking Australia and New Zealand The National Walking and Cycling Participation Survey (NWCPS) provides insight into walking and cycling activity across Australia and is a successor to the National Cycling Participation Survey which was conducted biennially from 2011 to 2019. |
02/09/2021 | View |
 |
National Cycling Participation Survey (NCPS) Austroads The National Cycling Participation Survey (NCPS) is a standardised survey that has been repeated biennially since March/April 2011, with minor changes to the survey structure between 2011 and 2013. The NCPS provides data on cycling participation at a national level and allows for estimates of participation for each state and territory, and the capital cities and non-capital areas within each state and territory. |
20/05/2021 | View |
 |
Australasian Pedestrian Crossing Facility Selection Tool Austroads The Pedestrian Facility Selection Tool is designed to help Australian and New Zealand practitioners select the most appropriate type of pedestrian crossing based on walkability, safety and economic outcomes. |
20/05/2021 | View |